This project was part of my Cognitive Design class. In this project, my teammates and I applied user centered design principles and methods to create a transportation orientation program for UC San Diego freshman and transfer students. 
Design Opportunity
Design Process Overview

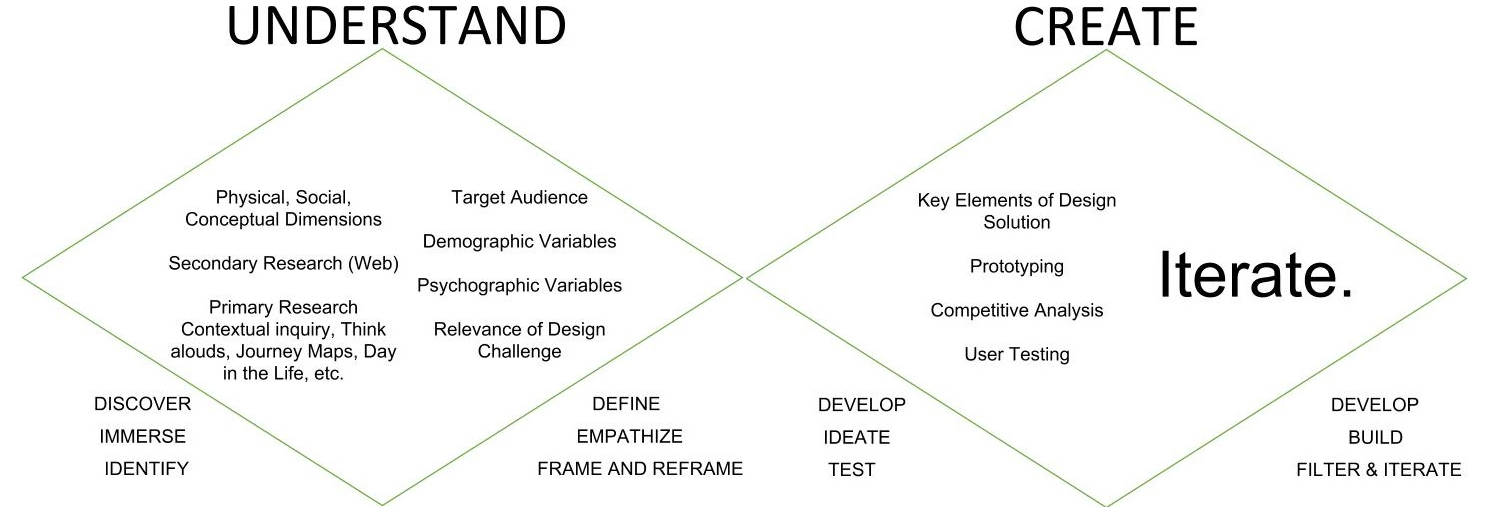
The Double Diamond of Design

Understand 
The first barrier to accessibility of the current transportation systems on campus is the lack of awareness about them. 
We conducted secondary research of the various methods of transportation online through the University transportation website and its affiliates. 

Secondary Research
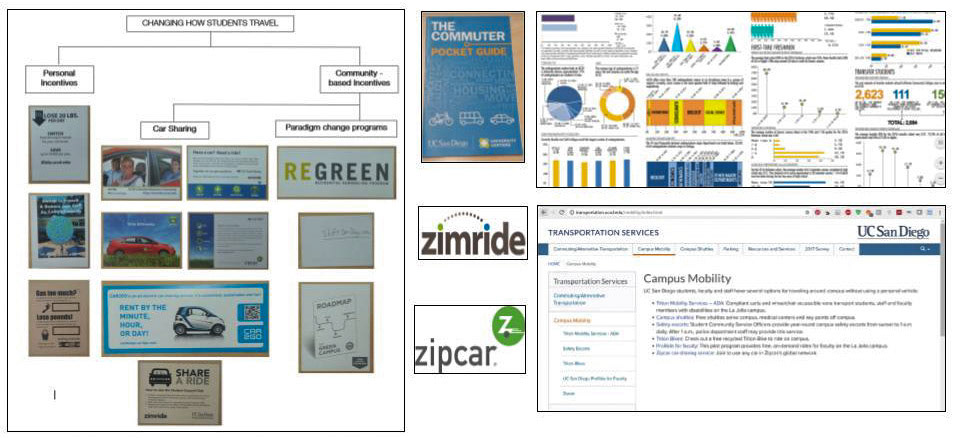
We looked at transportation statistics, options and resources distributed to commuters. 
The Transportation department has a lot of programs geared towards changing how students travel. These can be grouped into those based on personal incentives (health, exercise, environment, etc.) and on community based incentives (car sharing, biking day, etc.). 

Contextual Inquiry 
Brainstorm
Before conducting the research, our team brainstormed the possible issues related to transportation and the various modes of transportation. This guided our interview and research process.

Affinity diagram representing the results of the brainstorm.

To explore the different modes of transportation on campus that need improvement, we interviewed undergraduate UCSD students, professors, environmental enthusiasts, and the marketing manager of transportation on campus. In these interviews, we focused on the current transportation options available, how people used them, and the downfalls of the current system. By interviewing people with a broad range of expertise, we were able to explore different viewpoints on what students found to be the most inconvenient and their desires for new resources on campus as well as the school’s insight on what projects would actually be monetarily and logistically feasible.

We also took the time to observe people to understand how they interacted with transportation on a daily basis. This allowed us to observe physical interaction with the transportation options and to find flaws that people may not mention in interviews because they are so used to the inconvenience that they don’t even notice it anymore.
The majority of our interviews and observations were carried out within UCSD or in neighborhoods nearby because those are the locations we identified would be most relevant to our target audience or where were most likely to find people within the context of transportation.

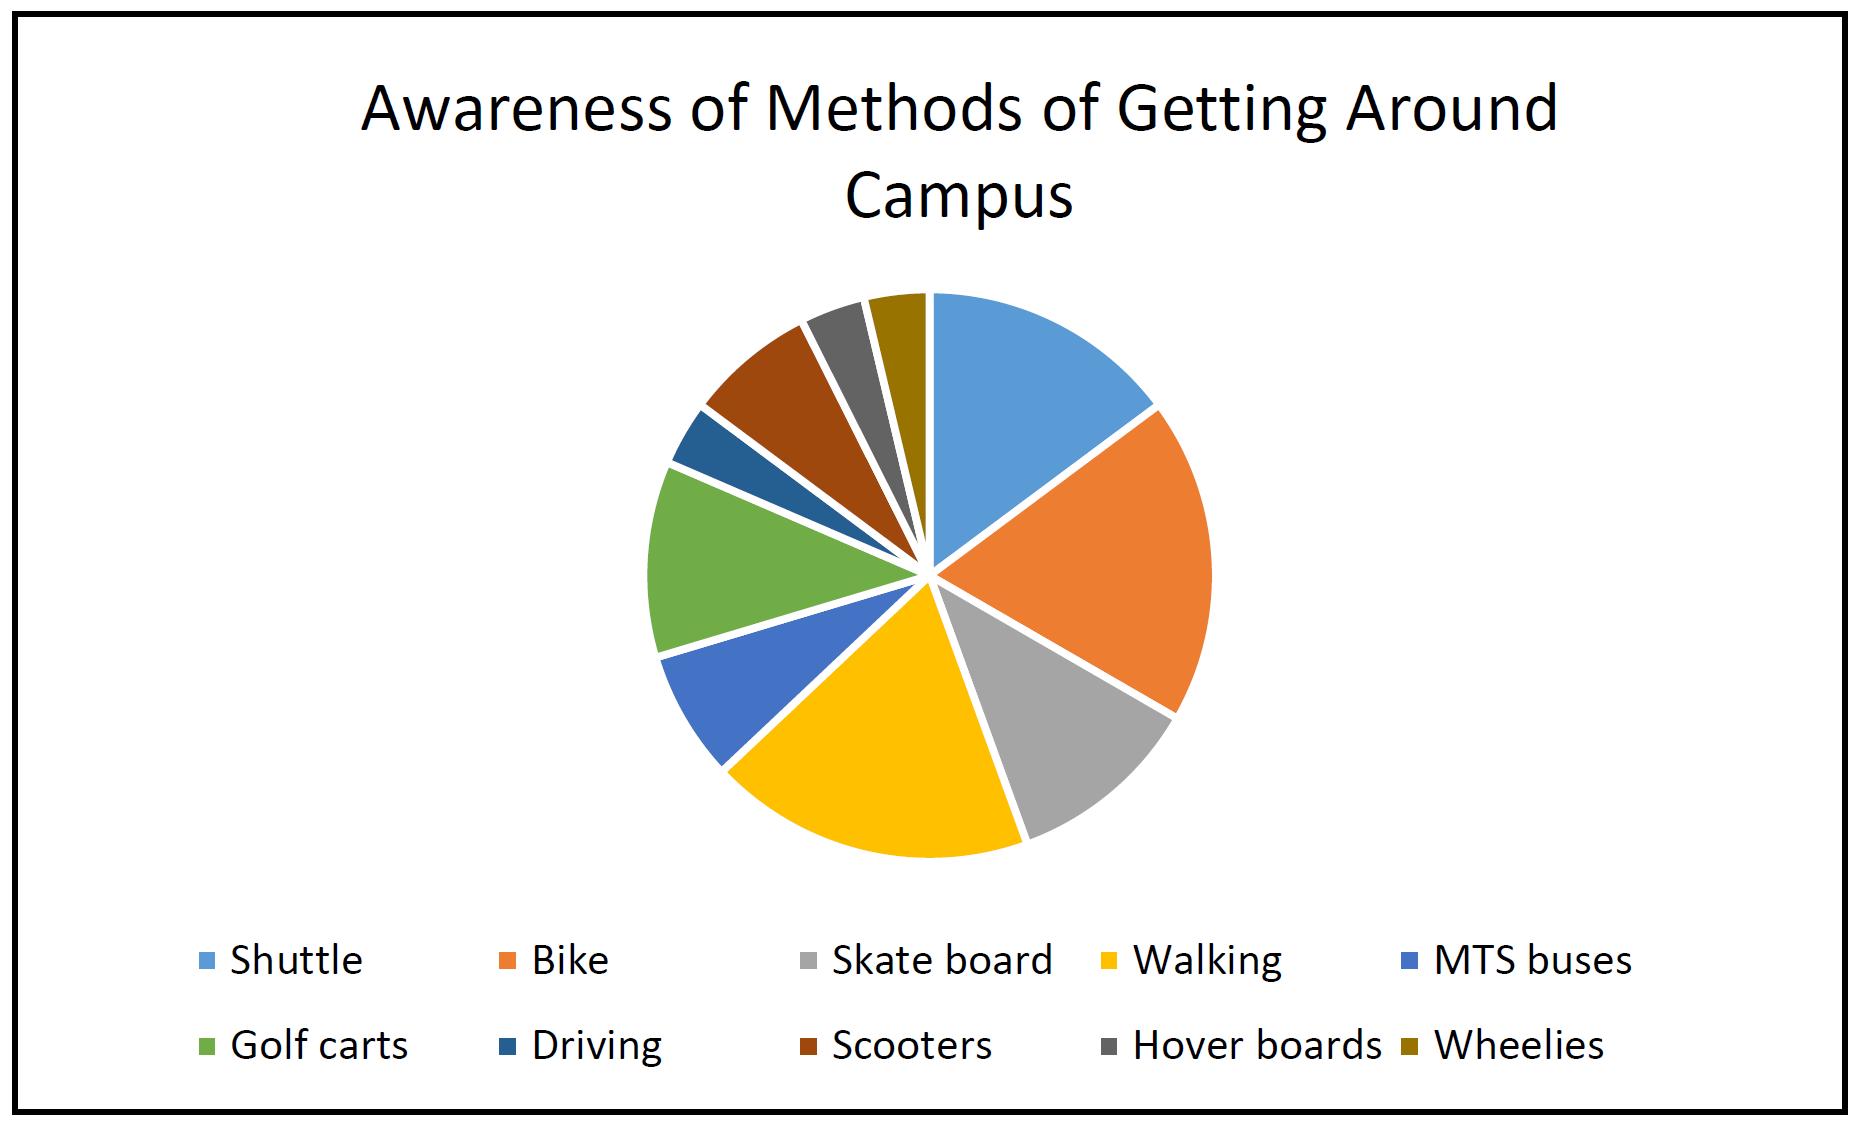
I asked students "What different ways are there of getting around campus?" to learn about their awareness of the different methods available. Each section of this pie chart shows a different method and the size of the section depicts the number of people that were aware of the method.

We found that there are a variety of services offered by the transportation department such as Triton Bikes, caged locking facility for bikes, Zimride, etc., that many students are unaware of.

I asked students whether they had used any of the services offered by the Transportation department to understand which service was the most popular. Some students had heard of certain services (like Triton Mobility Services and Triton Bikes) but had not used them.

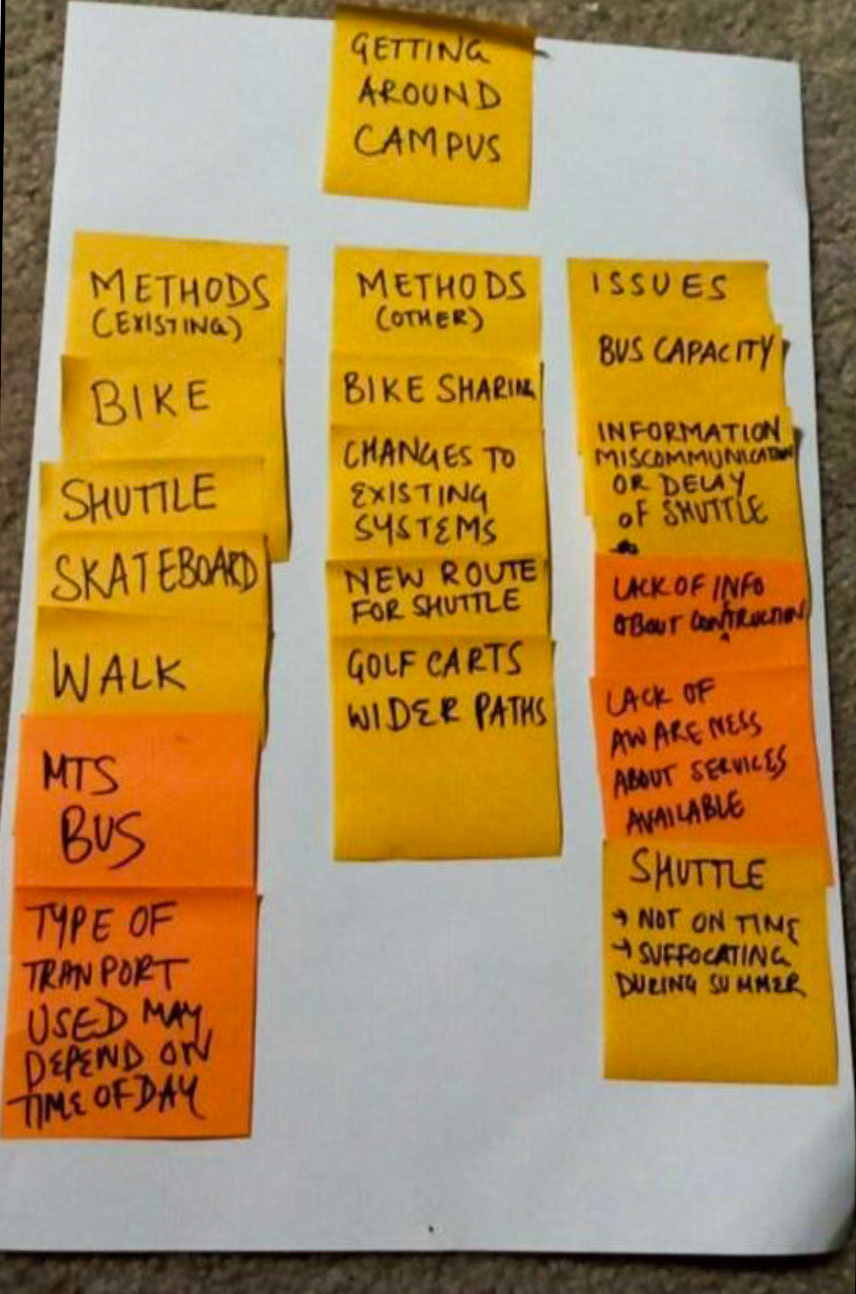
This is an Affinity Diagram that summarizes the results of the student interviews and groups methods of transportation they were aware of/used and issues with those methods.

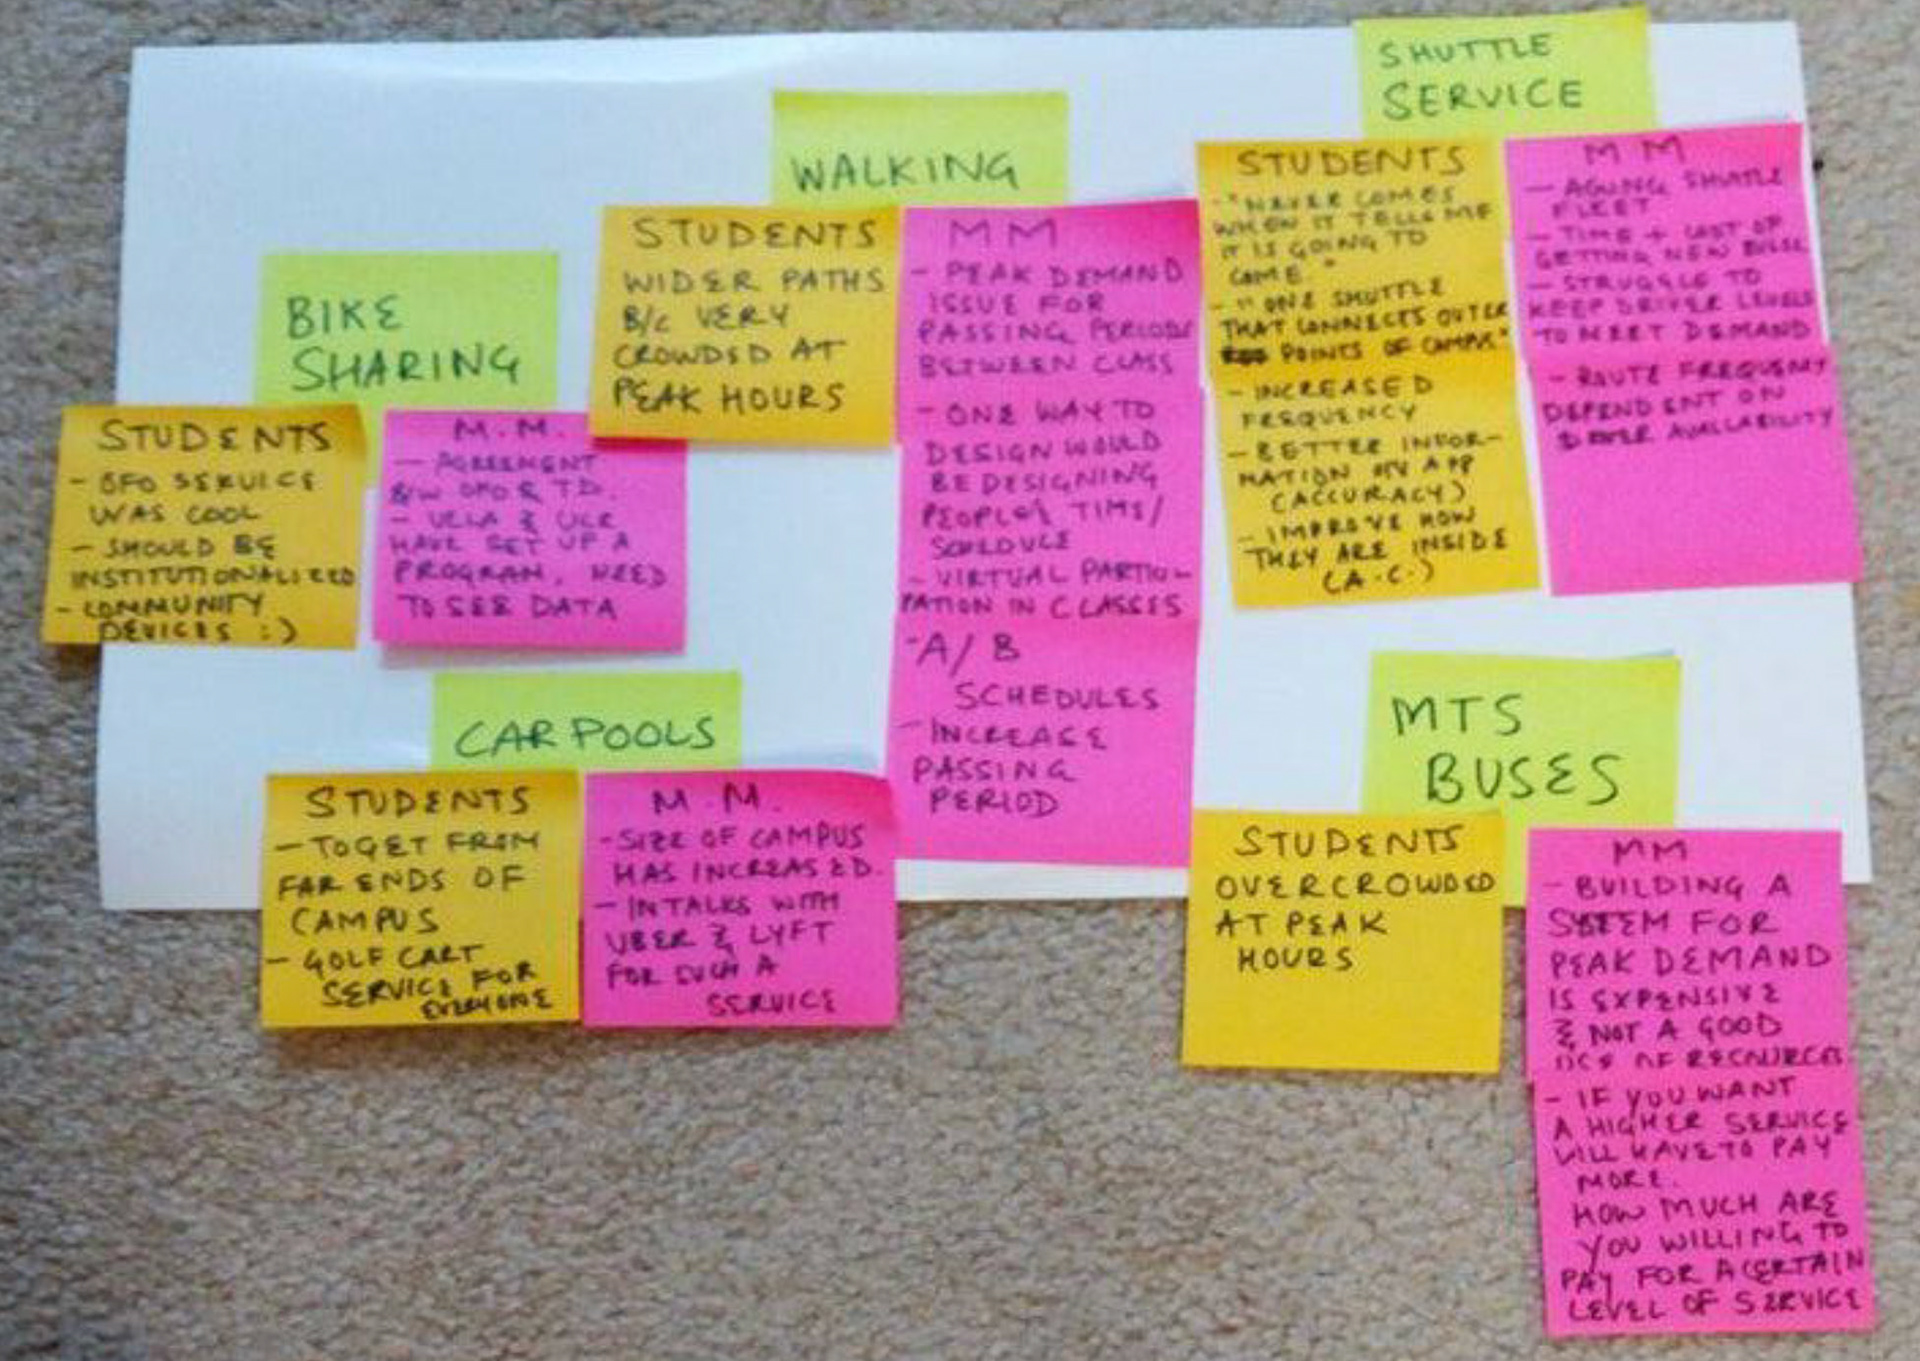
This represents a comparison of views between students and the Marketing Manager of the Transportation Department at UCSD on different modes of transportation and the problems encountered with each.

Day in the Life

Students drew and explained their day in the context of transportation.
Journey Map

They were then asked to do the same thing with a map of campus. 
Dimensions of the Problem
In order to further understand the problem, we decided to summarize the different conceptual, social and physical dimensions of the transportation problem.
The major conceptual dimensions of our design challenge are convenience, safety, cost, time, and attitudes about exercise/energy conservation.
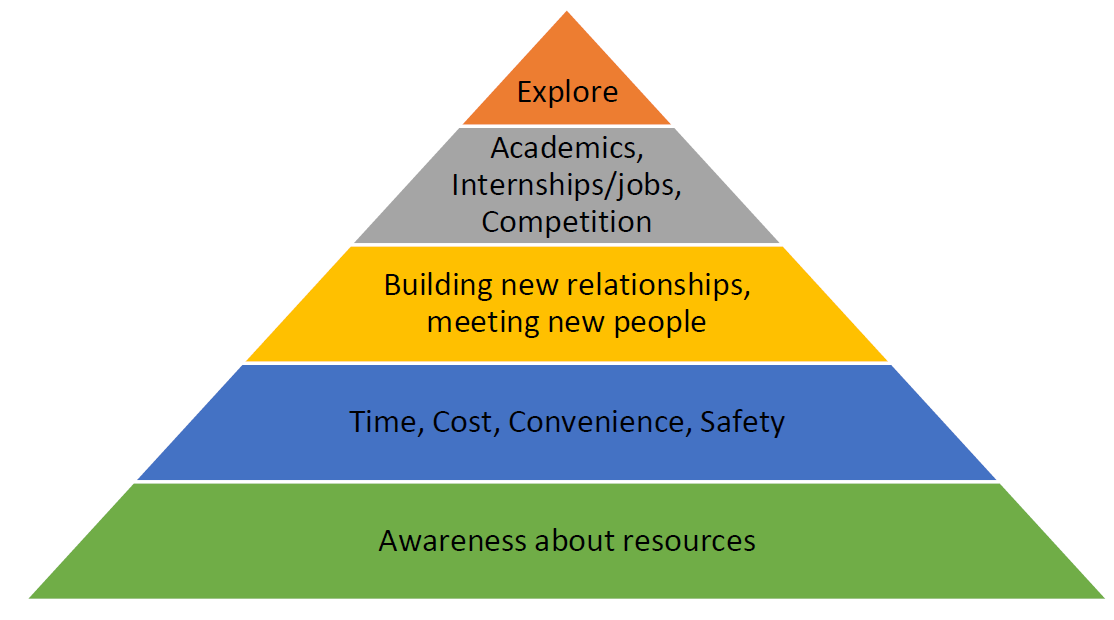
The interaction of and balance between many of these factors underlie the transportation decisions made by students.

The physical dimensions of transportation involve students physically interacting with the information presented by the transportation system (markings on roads, apps, brochures etc.), the actual locations that they travel to and the paths they take to get to their locations.
They also involve the modes of transport they use (vehicles), the physical structures of the stops/ transportation hubs, the bodies of the students that need to be moved and the maps that are used to represent these.
Social dimensions include social norms, social proximity, social etiquette and interactions.
Public modes of transportation shape social interactions as students must follow rules of social etiquette such as waiting in lines to use certain transportation. 
The norms for physical/spatial proximity and interaction are context dependent and hence the choice of transportation may affect how a student interacts with space in a social manner. The degree of social participation varies across the various modes transportation and determines the social role that a commuter plays.
A Problem Worth Solving
Our design challenge is relevant because effective awareness about the different existing programs can help students design their commute in a manner that is more convenient, cheap and time efficient. These are factors that we discovered during contextual inquiry that govern student transportation and mobility decisions. 
Moreover, education about the safety standards for the use of each mode of transportation can create safer commutes and allow for safe transitions in case of multi-modal mobility. 
Hence, awareness is important to promote this shift, giving birth to the need for a Transportation Services Awareness program to be added to the freshman and transfer orientation so new students can familiarize themselves with the services available.
The User
Demographics 

Our target audience is UCSD freshmen and transfer students who are new to the campus. Therefore our audience is generally within the age ranges of 17-24, with additional transfer student outliers that may be older as well. 
We decided that our design recommendation would be best learned early on in their student career, as opposed to focusing on seasoned students at different occasions and events, so that they can maximize the available transportation alternatives in terms of getting around San Diego and on campus as soon as they start college.
A majority of first years and transfer students live on campus in dorms or apartments, and some transfer students may have off-campus housing. In 2016, there were 8,630 new freshman and transfer students. Of this, only about 16% of the incoming student population was from San Diego and was thus familiar with the city wide transportation system. For other students, the system may be very different in the area they come from.

This creates a need to educate these students about the services available as soon as possible.

Psychographics

In our initial research we found that the freshmen are not aware of all of the accessible transportation options. As a result, many freshman may feel constrained within the UCSD campus and many of them are less inclined to explore areas away from campus.
Upon conducting interviews with authorities that are responsible for understanding the freshman profile we learned more about the central tendencies of our target population as depicted in the pyramid modeled off of Maslow’s Hierarchy of Needs. 
Freshman are largely focused on social and academic exploration, career development, building new relationships and meeting people. Hence, their transportation needs center around these factors (for instance, commuting for internships, exploring the city with friends, etc.) but are still guided by the conceptual dimensions of time, cost, convenience and safety. However, at the very base, an awareness of resources is what propels them to pursue their interests in line with the aforementioned conceptual dimensions.
Create

This Affinity Diagram represents an initial brainstorm of all the possible solutions we could think of pertaining to the transportation problems we found in our Understand phase. Note that we considered solving all the problems we encountered and later decided to solve the one pertaining to Awareness through an orientation. 

   Key Design Features

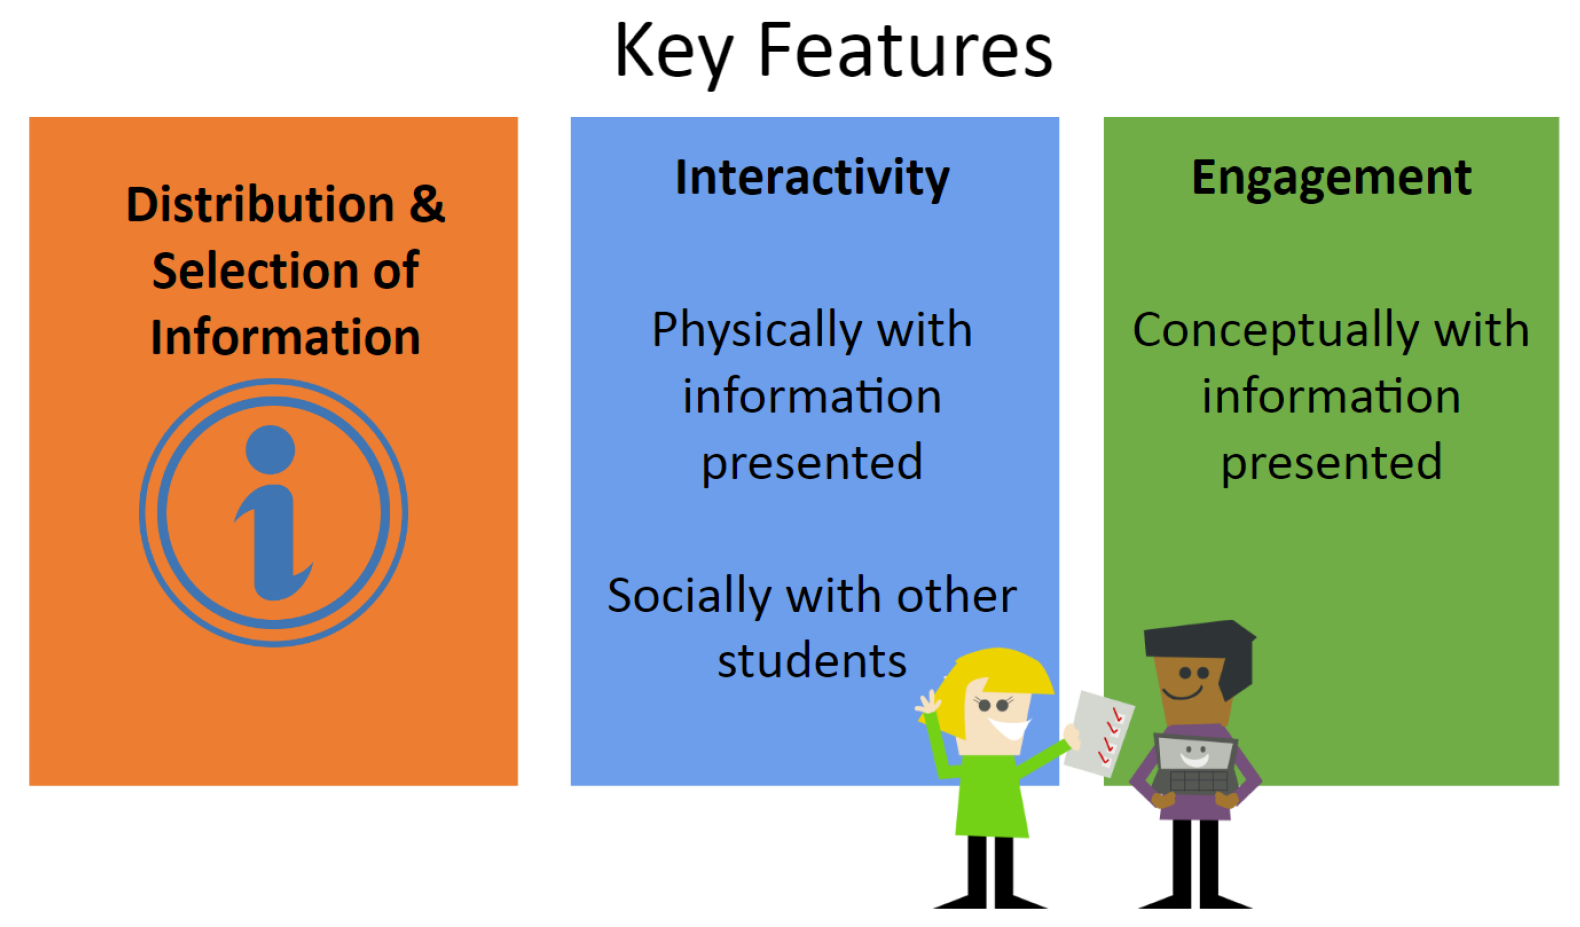
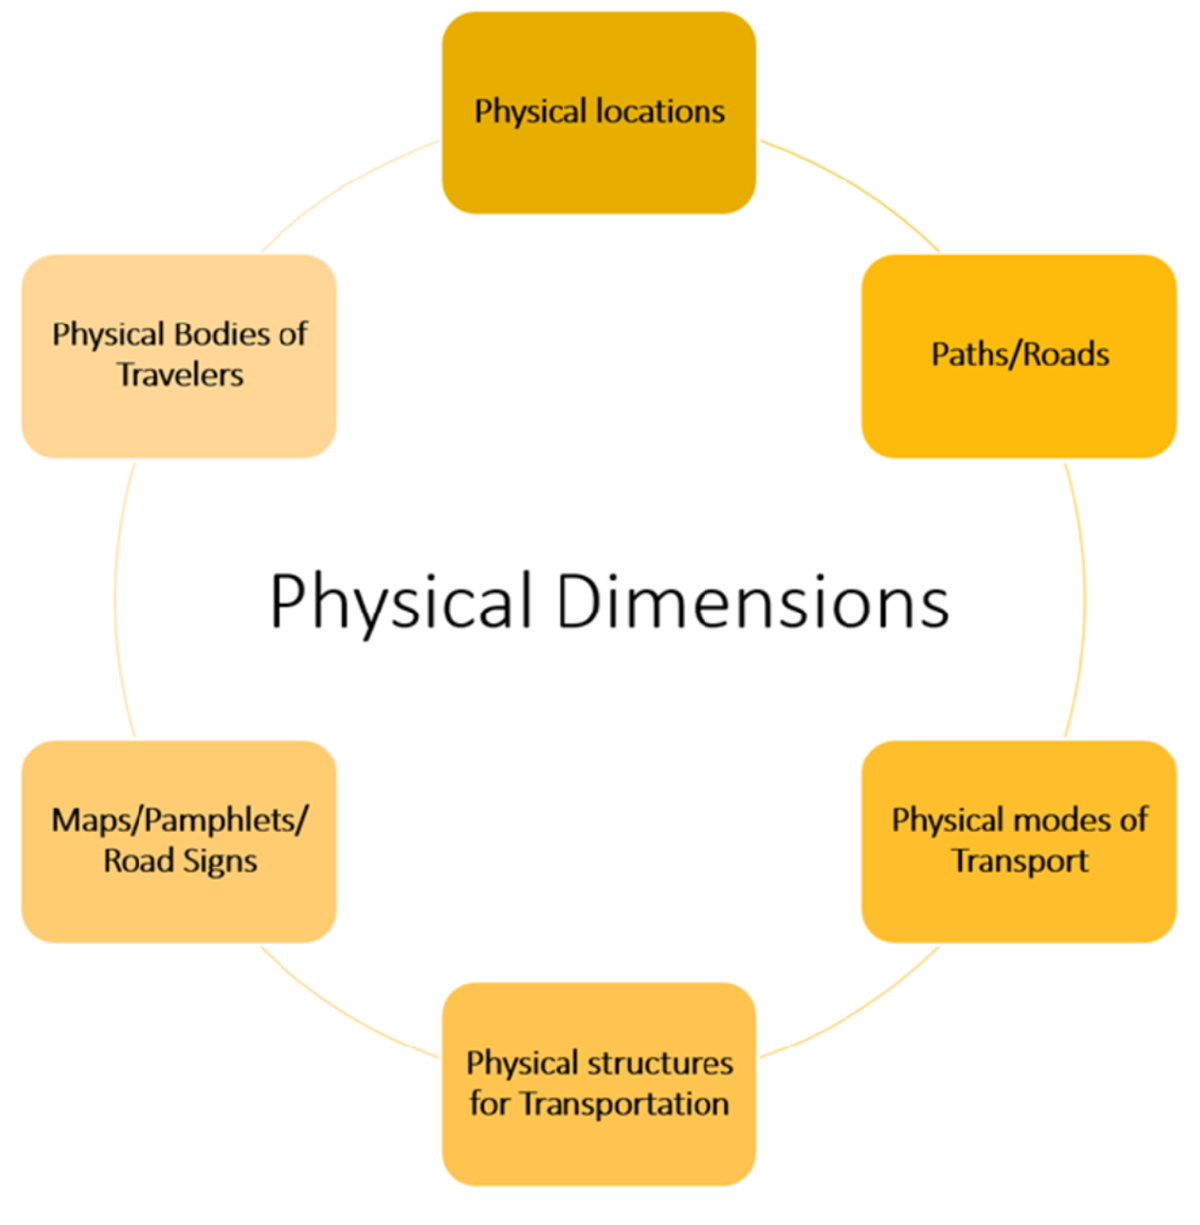
We wanted our prototypes to have these key features based on the physical, conceptual and social dimensions we uncovered during our understand phase.

Prototyping and User Testing
We tested our prototypes at various locations on campus where we would be likely to find students. We tested with about 26 people total and in average, each session to test our prototypes took about 5 minutes. Initially, we asked them about their student, housing, and commuting status and then urged them to start interacting with our prototypes.
Prototype 1

Our first prototype was inspired by the card sort method. We created a card game to be played in groups wherein students were given a stack of cards containing information about the various transportation services and options and prompt containing a commute problem. 
The students were then tasked with solving the prompt using the available resources. 
However, we found that this version of the transportation orientation required students to 'remember' the cards which affected the solutions they came up with. Hence, we decided to have all the information readily available in one glance in the second iteration of our prototype.
We also realized that new students may not know where locations such as Clairemont are or if it is possible to get there by bus. Hence we decided to incorporate that information in our next iteration. 
Physical handling of the cards seemed to be person specific as some people felt more comfortable handling them than others. They way that people interpreted the prompt differed vastly and there was an apparent gap between our intended question (prompt) and the interpreted question.​​​​​​​
Prototype 2
This version of the orientation program was also a game that students would play in groups, except it had more information available such as maps and bus routes.
During testing we realized that while participants took some time to read all the options, the organization of the information made it so that all of it was available at the same time. However, the maps and the bus routes were still confusing to the students because they were overly detailed and hence overwhelmed the participants.
Insights
We learned that although our idea of our prototype was clear to us, it was not clear to our target audience and our peers. Our expectations of how others would react to our prototype were wrong. Many did not understand the use of the prototype or what we had written. There were constantly ways to improve our prototype, from color coding to adding logos for the different transportation services, to changing the orientation of the placards, to changing the maps themselves. 
Each iteration helped others understand our prototype a little better, but some of them also led to more confusion, such as our initial addition of a map.
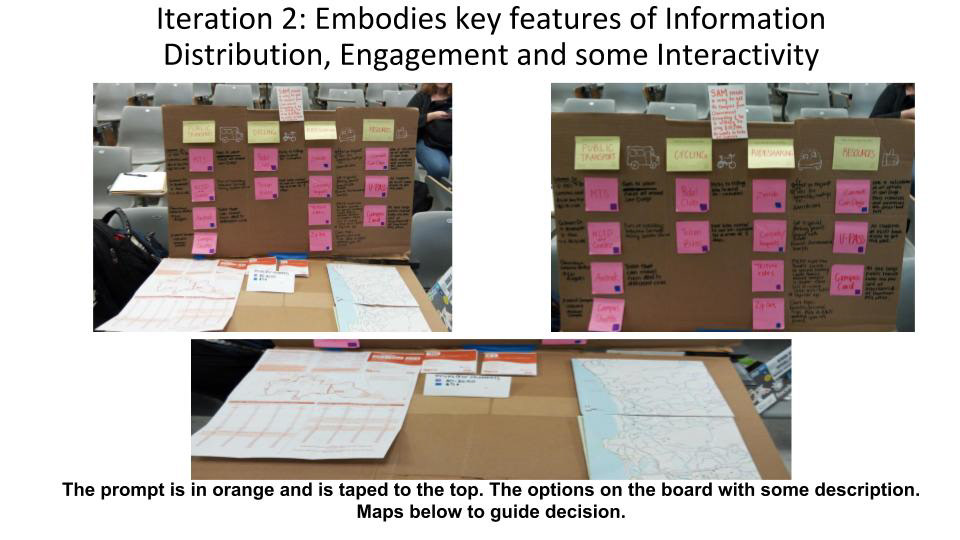
We also learned that some participants brought up pairing the mode of transportation with other information such as examples of usefulness and warnings/advice. Participants were curious about where and how the information would be available and came up with a few suggestions. 
Participants seemed to want visuospatial aids for the way the information was presented. In the absence of such an orientation, participants seemed to have learned about the services offered by trial and error or through the internet. Participants’ transportation decisions seemed to reinforce factors of convenience, cost and time when they justified their choices.
The transportation solutions participants came up with differed based on the way the information was presented to them. The way the information was presented had an impact on how well it was received. People in groups bounced ideas off of each other, arguing why a certain method was better. It was not immediately apparent to the participants that they could touch and interact with the second iteration of our prototype.


Final Prototype
Our design solution is a game to be played at the freshman/transfer orientation to inform students of all the different transportation options available. The students are handed a situational card and must use the board to find the most appropriate form of transportation. This design is valuable to the newly admitted UCSD students because it introduces all the different transportation services on campus in a clear, interactive, and informative manner.
Our game design is a presentation board with a top and bottom section similar to an open laptop. It is foldable to make it more portable and all of the cards can be placed in a pouch on the board so that they don’t fall out, making the game easy for orientation leaders to transport. Although our prototype is made on cardboard, the finished design would ideally be on a thinner, laminated material so that it is even lighter and would not have any problems with getting ruined if wet.

The top half of the board is used to display all of the transportation options available for UCSD students, which are grouped and color coded based on areas of use so that students can search through them more easily. We added pictures or logos of each form of transportation in order to help users identify what they are looking for faster, and recognize it later on. Each option includes pricing information on the bottom right corner as well, as cost is often an important deciding factor for many student’s choice of transportation.

Each transportation option is a flap that can be lifted to reveal more information, such as an explanation of what it is, where it is accessible, common destinations it is used for, and its website. This not only makes the game board more interactive, but also allows us to give them more information without making the board look overcrowded.

The bottom half of the board has transportation resources, situational and prompt card piles, UCSD’s commuter guide pamphlet and a map. The resources are similar to the transportation options in that they are flaps that can be lifted for more information. The prompt cards contain the same information as the transportation options that are on the board, so that multiple people can be looking at the same information at any given time.

The map is extremely oversimplified so that it emphasizes the transportation options as opposed to geographical details. It shows the common destinations that UCSD students travel to, along with the transportation options available at these locations.
How to play

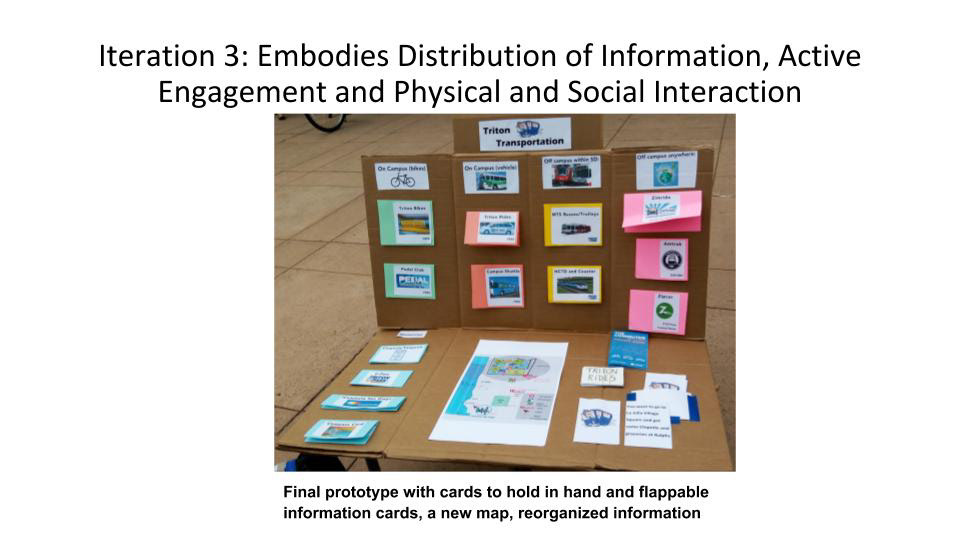
An orientation group typically consists of about 15 new students and one orientation leader. Each individual orientation group will play the game as a part of their program, so that it is in a more personal setting where each person can be involved and interact with the physical prototype and people won’t be nervous about answering in front of a large group of people. The game is played in mini teams of 3 people (5 teams in all).
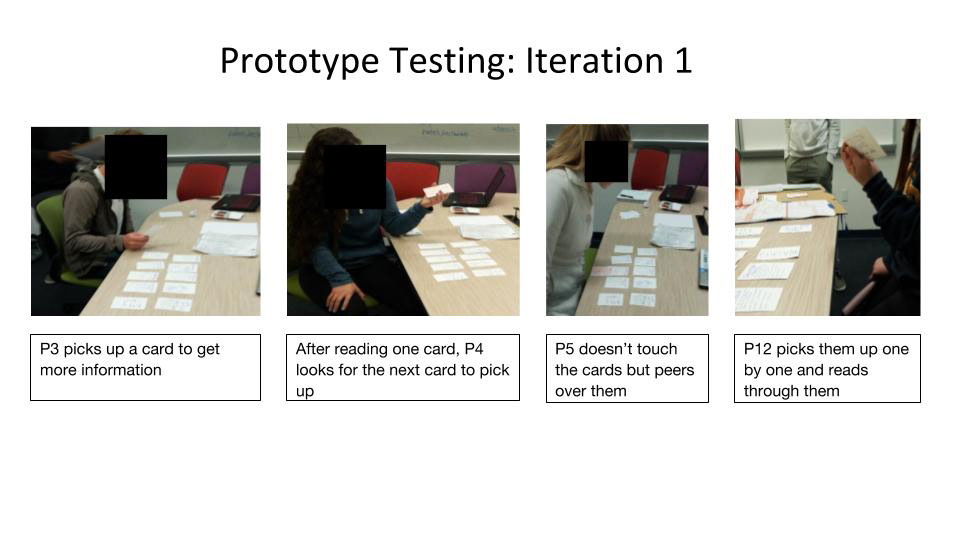
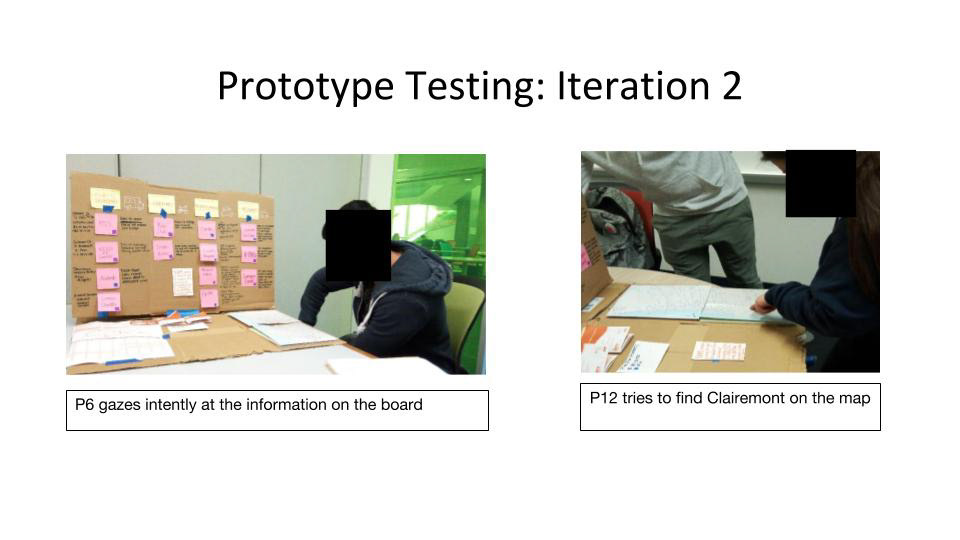
When it is a team’s turn, they pick a card from the situational cards pile and search through the board to find the best solution.

The orientation game is embedded within the socio-cultural system of society and the university (orients students with the transportation culture of the university and the city), the university educational system (the orientation provides information to educate students about the resources available and is designed for college students), the economical system (provides cost information to ensure students plan their commutes accordingly), the city-wide transportation system (the orientation aims to ensure smooth transition of incoming students to the available transportation options), the legal/political system (it informs students about the rules they must follow to legally and safely use the options presented) and the information system of the university (the orientation provides relevant information about options).
Competitive Analysis
What we learned most from our competitive analysis was “what not to do.” We identified issues which our target audience currently had with existing solutions. For example, students often found the maps by the bus stations or in pamphlets difficult to read or find their desired location due to the excess of information, street names, geographical locations, etc that are put into a single map. This led us to oversimplify our map to negate most geographical elements and focus solely on the most popular locations for students. There were similar occasions in which this occurred such as having titles written versus having the labels, having flip-ups instead of having the information written to the side of the titles of forms of transportation, and also having the game be a completely separate thing from the board itself.

We took a look at some of the downfalls of transportation options such as uber/lyft (expensive), ofo (kicked off campus for insurance reasons), bike rack installation limits (as explained by the marketing manager), construction on campus, 4000 parking spaces for approximately 25-30 thousand undergraduates, triton bike limitations, and disadvantages of bus wait times. Although we were not fixing these transportation options directly, it allowed us to see why there is such a need for our design solution so that students to be aware of all of their alternative options.

We also looked at the commuter pocket guide pamphlet and other transportation advertisements, which contains information on most of the transportation options available. However, it is not a fully comprehensive list, and we found that many students ignore these resources and are not willing to take the time out of their day to actually read through them. 
Similarly, the transportation services department sends out emails to students regarding transportation options to use during traffic due to construction and special events on campus, but in our interviews we found that almost no students actually read them. This is what pushed us to create our orientation for transportation with the mindset that it was mandatory, and from there consider how we can make the experience enjoyable yet informative.

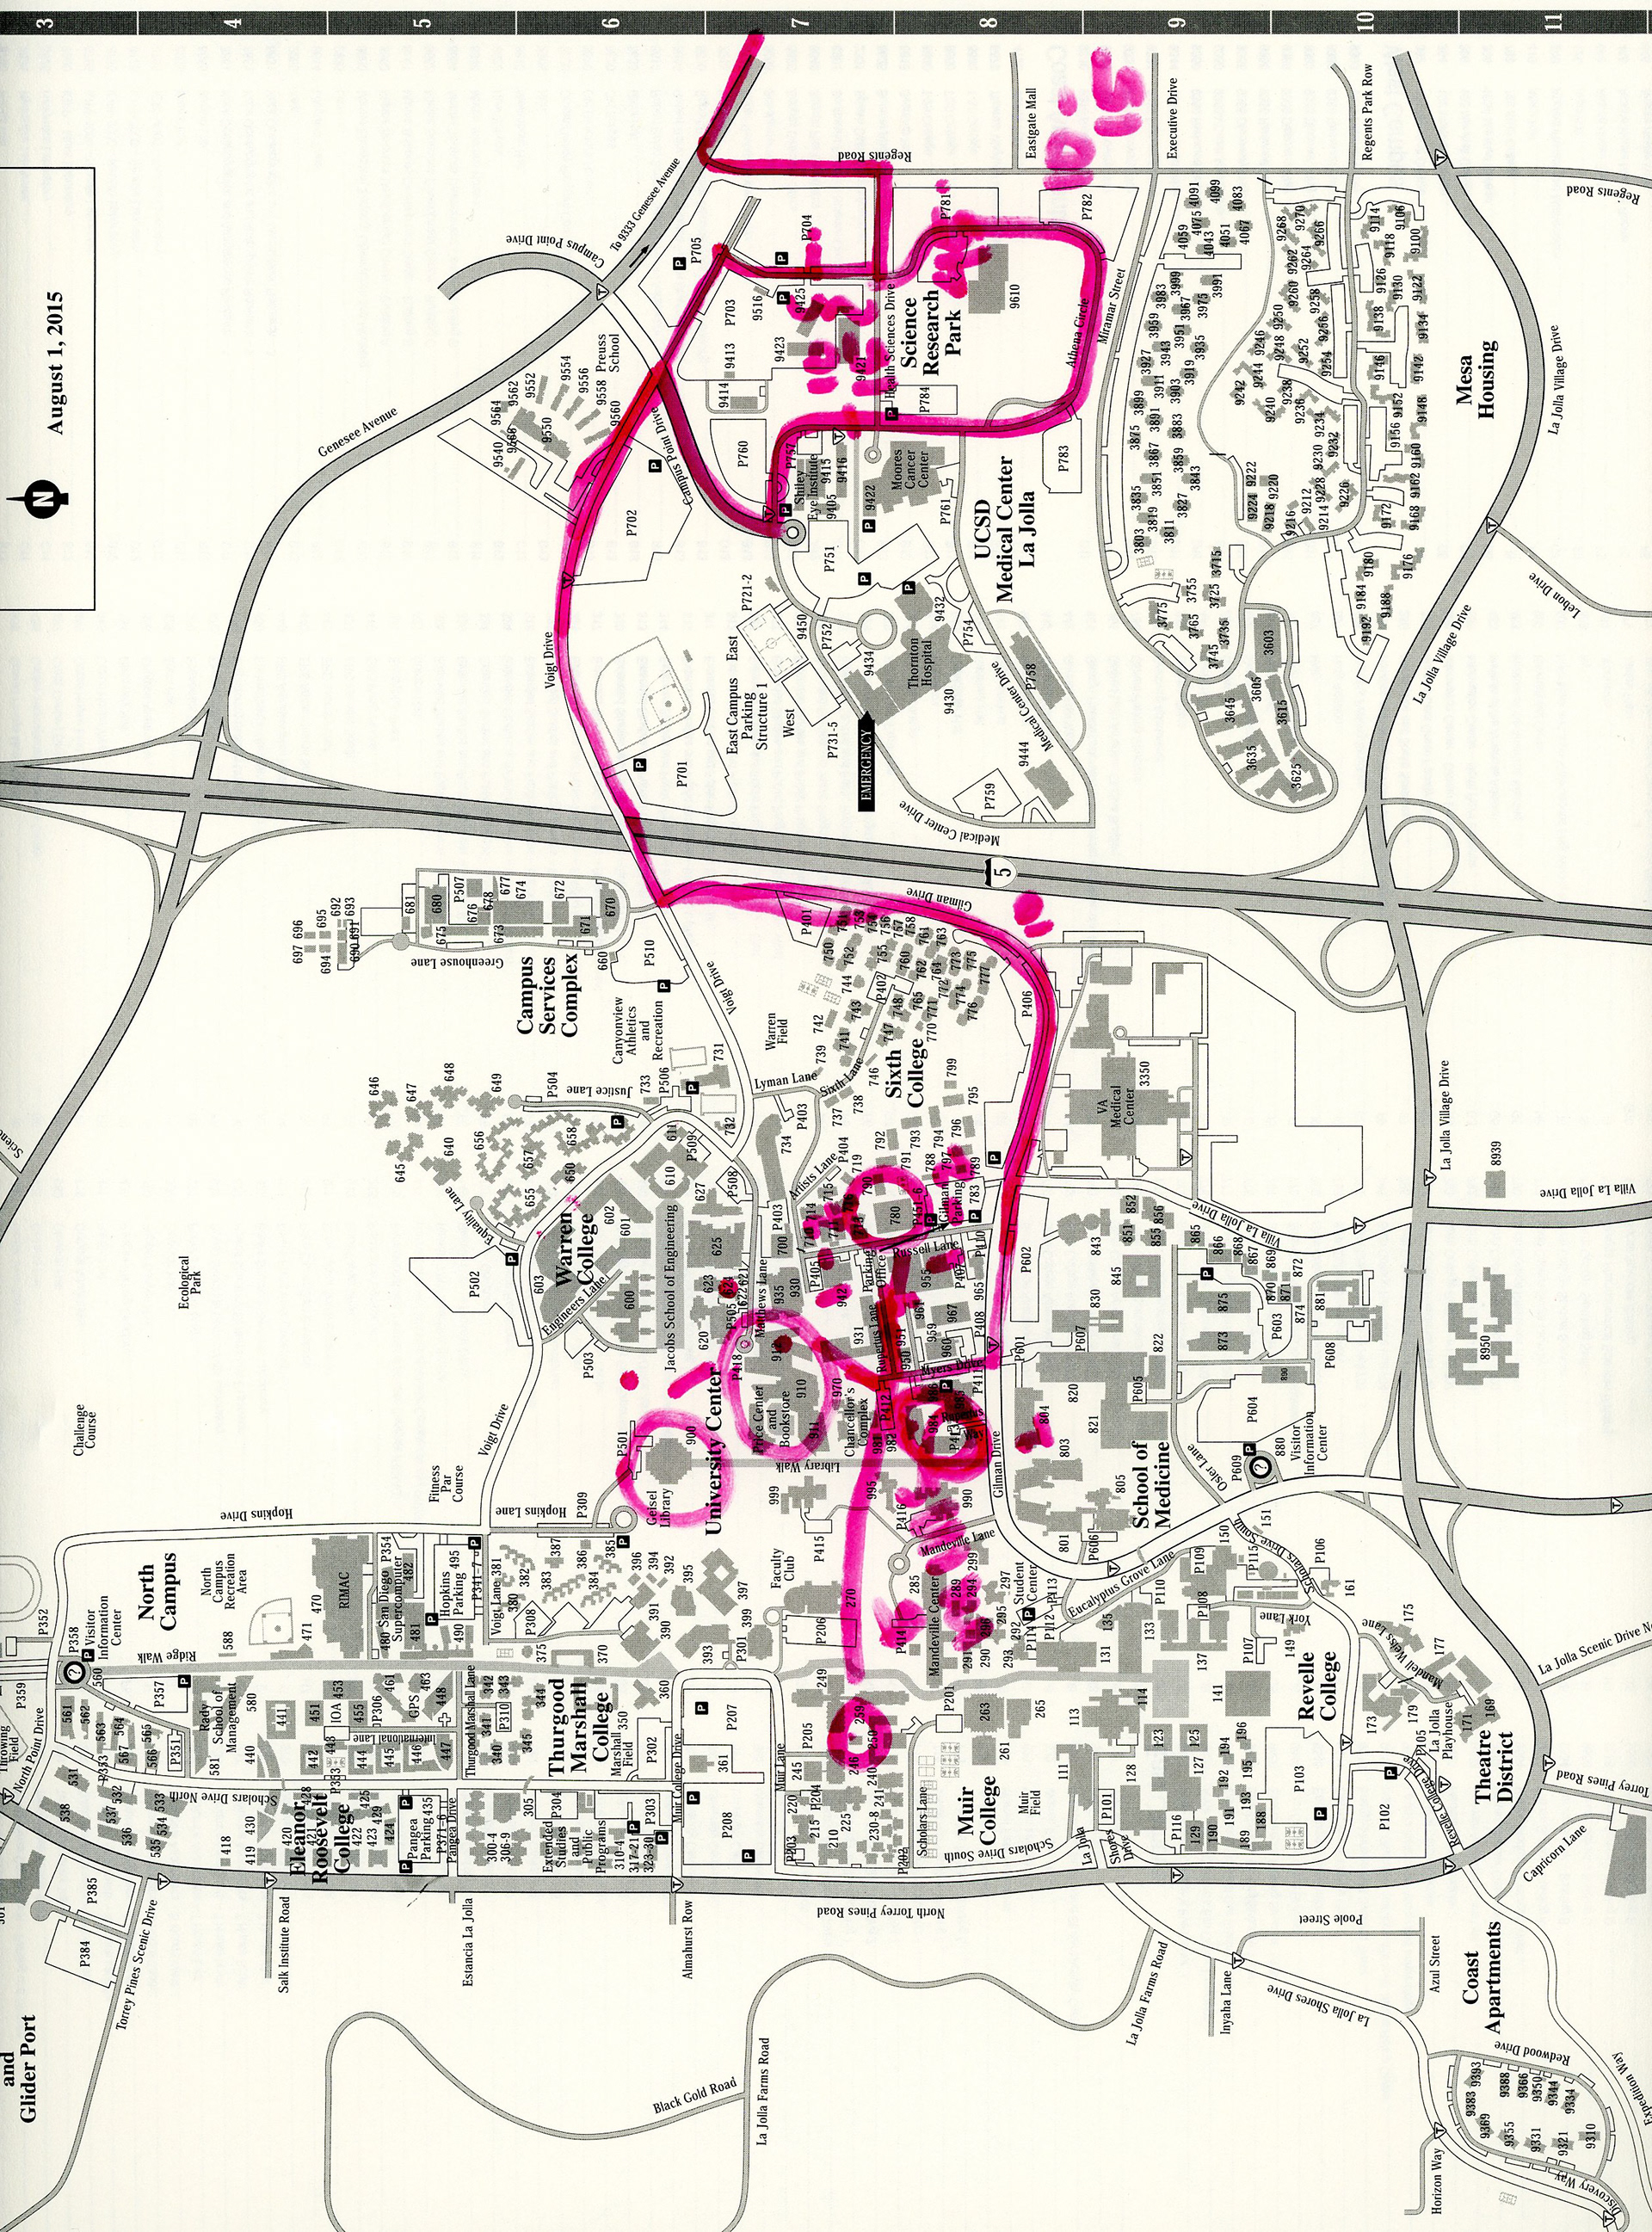
Nonetheless, they are ports to valuable resources and our design solution is also meant to aid in educating about available transportation alternatives to the students. So, we thought to have our design solution to be a supplement to the commuter pocket guide, a solution that is easily accessible and easy enough to distribute to students to bring around their daily commute. That is why we imitated the simplified map of the UC San Diego campus from the commuter pocket guide and integrated it onto the map we put on our board. By doing so, it would allow students to easily recognize places to commute on campus with the commuter pocket guide we would hand out after they played the game.

Additionally, we looked at the structure of orientation programs and realized that while they were online, mandatory and saved the University resources on organizing orientations that required participants to be physically present, they did not lead to the kind of actionable awareness we were aiming for. This is because most students just click through the various slides of the online orientation in order to finish it as soon as possible. 
Value Added
The players of the game finish the game with a better understanding of the many different forms of transportation available for UCSD students. In our user testing we found that students flipped the options that they were not aware of and made remarks such as ‘oh I didn’t know that’ or ‘that’s cool’. 
This suggests that perhaps the novelty of the information presented contributes to the effectiveness and usefulness of learning the information.
The interactive nature of the game ensures that players actually take in some of the information, as opposed to emails or pamphlets that get deleted or thrown away. 
It also has the benefit of being more fun than just reading words from a paper or having to listen to someone talk through a presentation. We tested the game on its own as well as the board on its own and based on the reactions from our users we concluded that a game and a board is the best and most efficient way for students to learn their transportation options.

You may also like

Back to Top