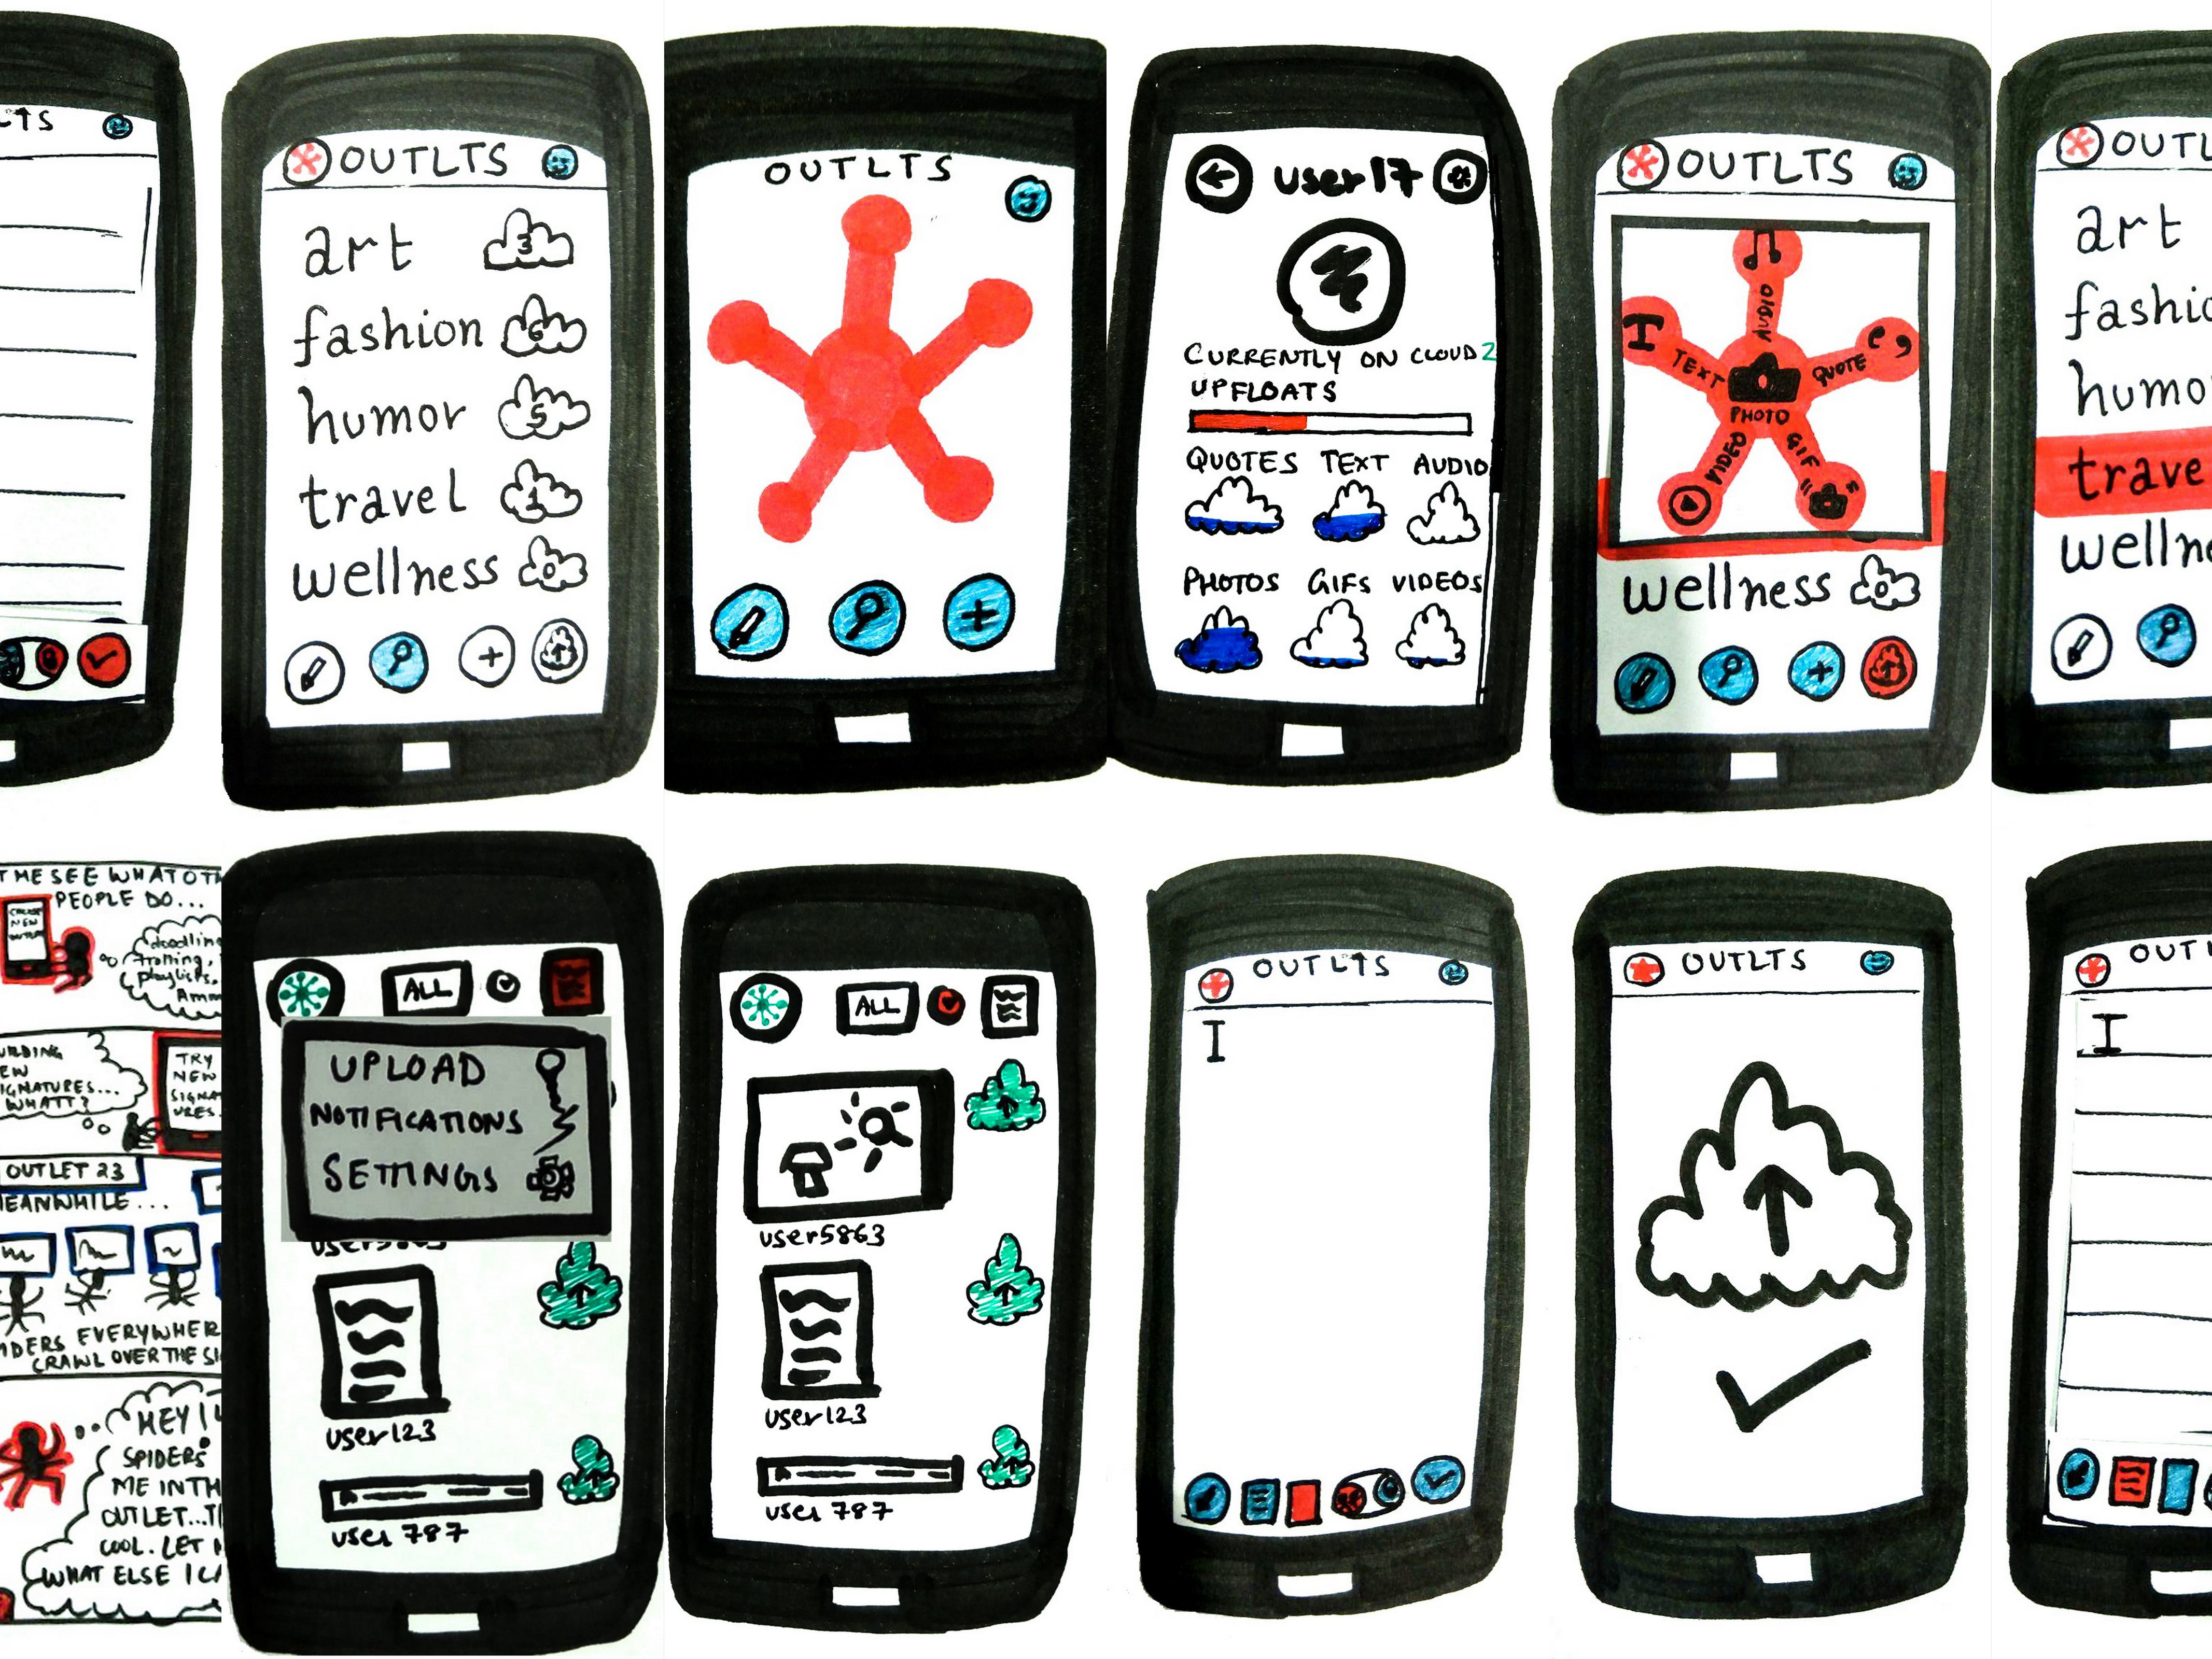
This is the first data science project I completed with Gregory Morgan and Bertha Sanchez for a data analysis course.
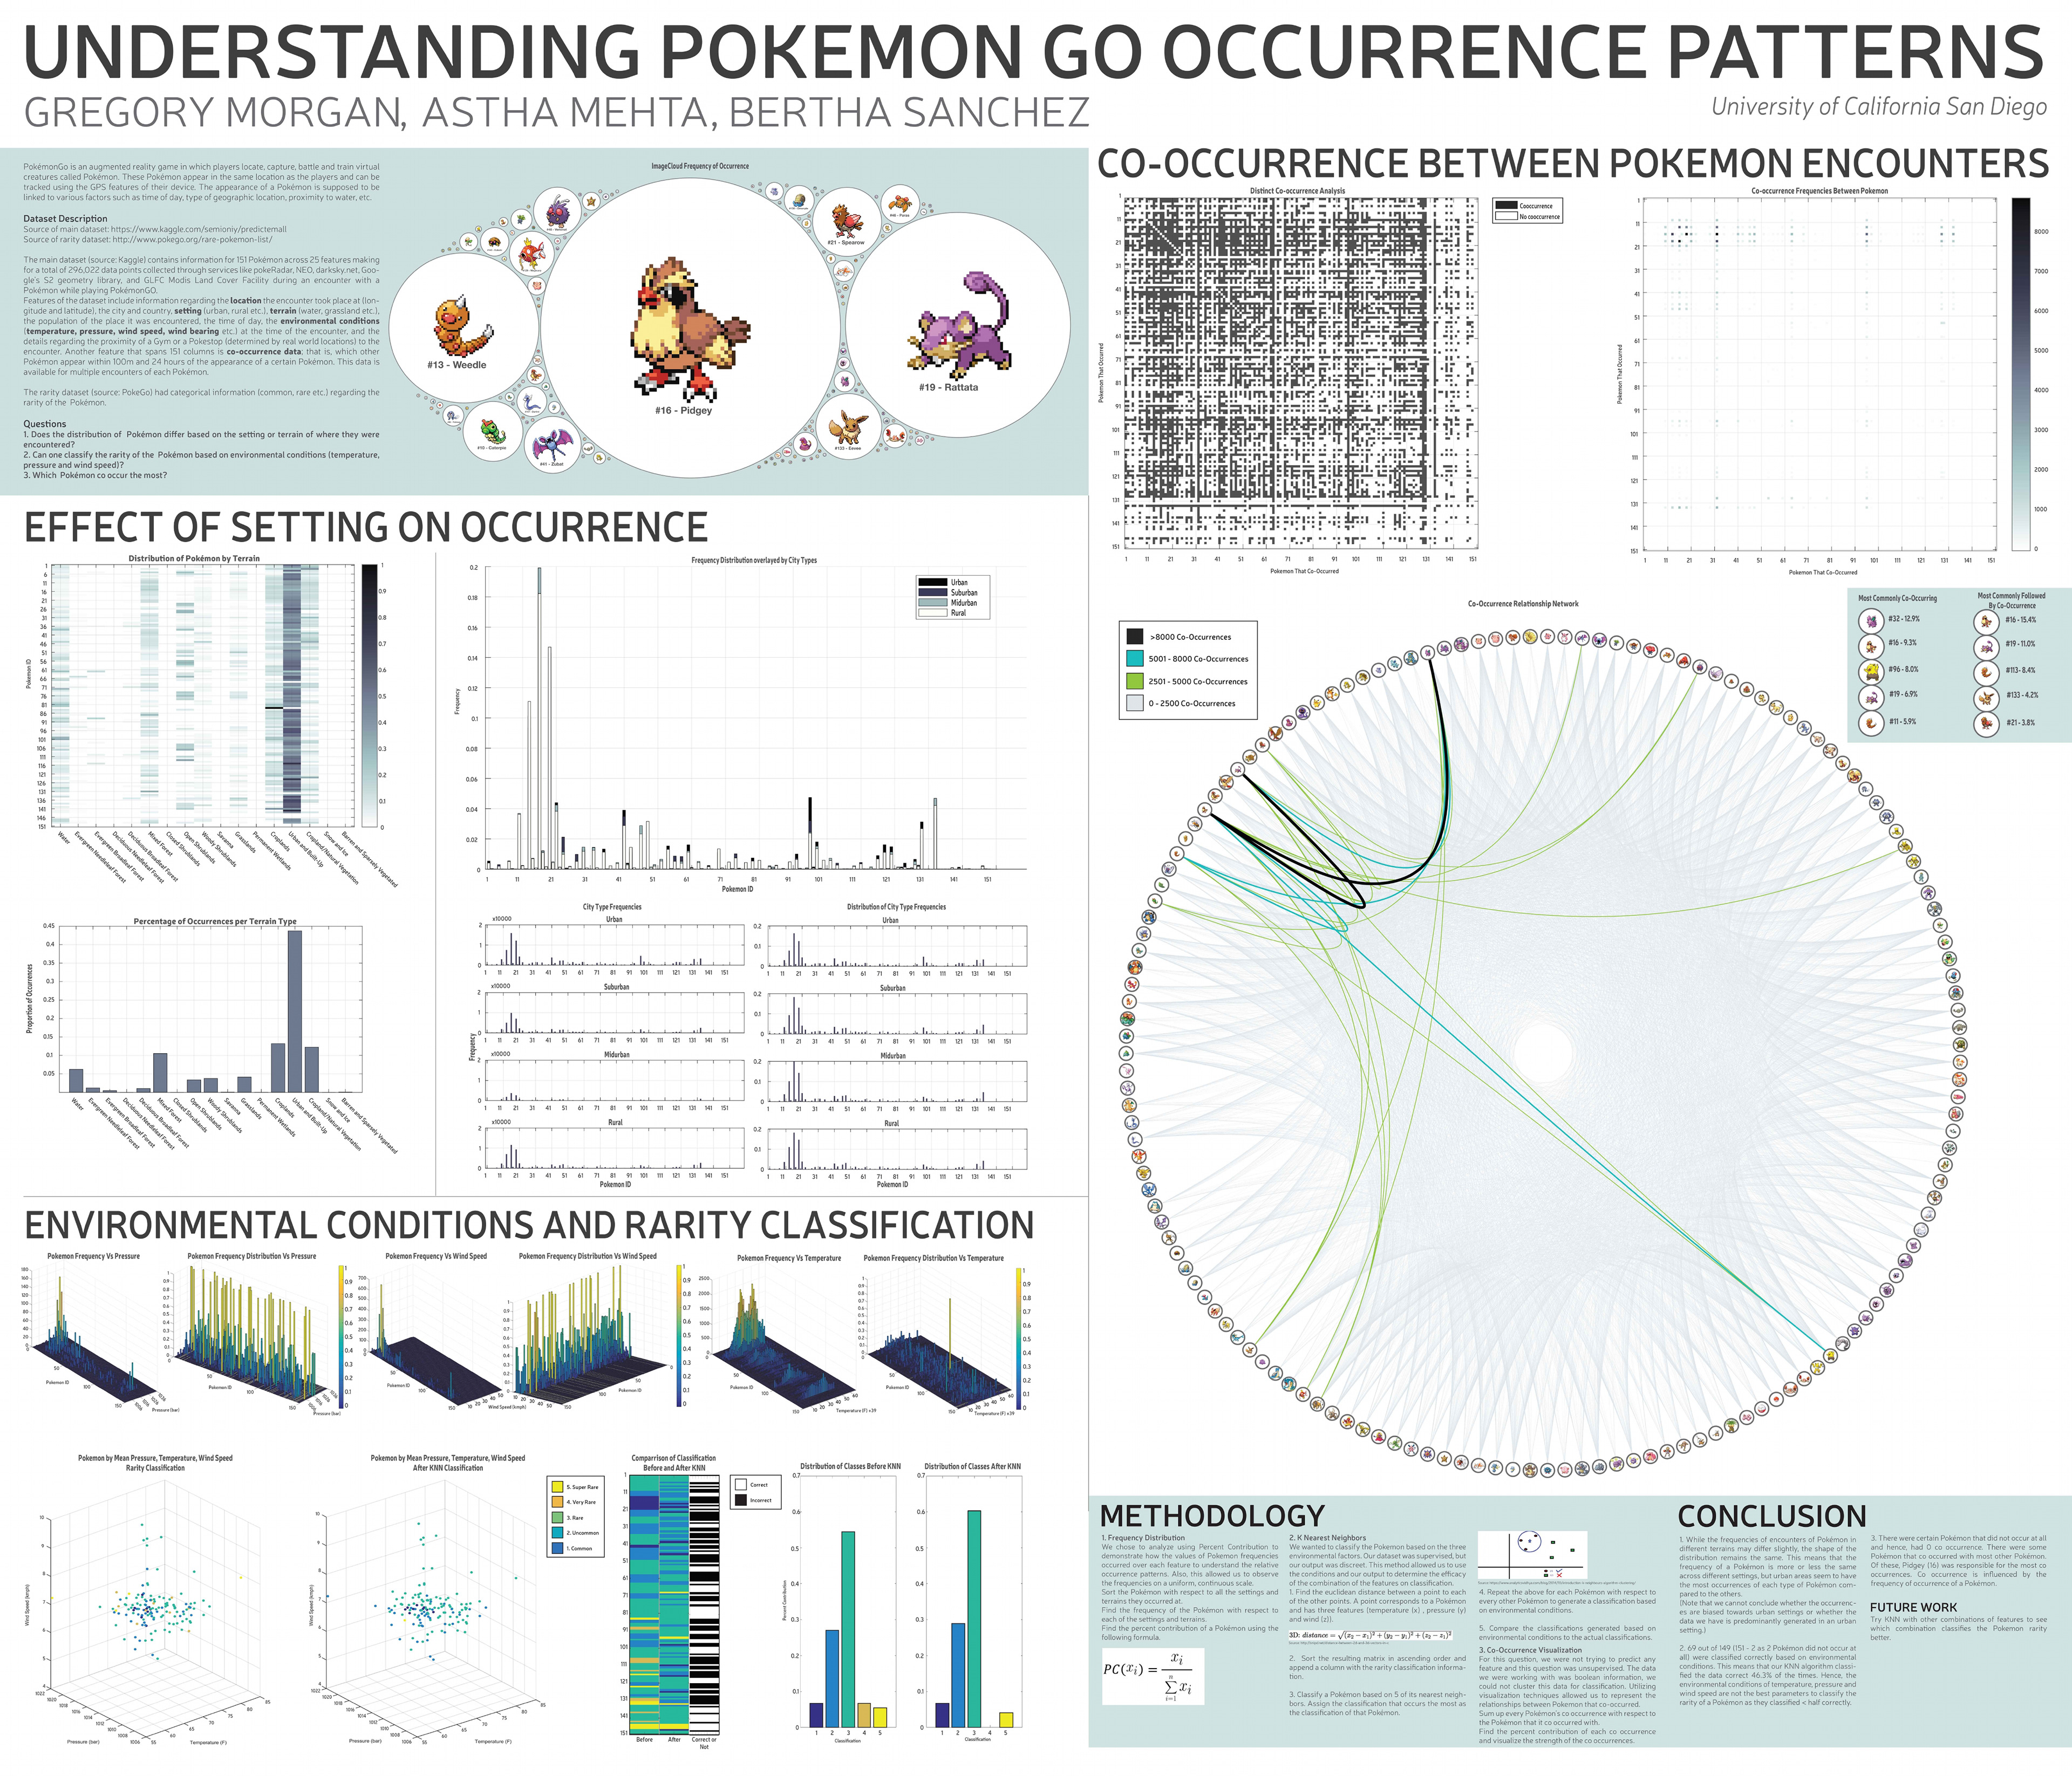
This is what the final project looked like. We had a poster presentation session wherein we presented our findings.
Dataset
We chose to analyze Pokémon Go data obtained from Kaggle.
The main dataset consisted of about 300,000 data points across 25 features that encompassed attributes such as location (latitude, longitude, country etc.), setting (urban, rural etc.), terrain (water, grassland etc.), environmental conditions (wind speed, temperature, pressure) etc. of where the Pokémon was found.
We also had co-occurrence data which provided Boolean information on whether a Pokémon occurred with another Pokémon given the same conditions, within 100m and 24 hours.
A supplementary dataset was also used for categorical information regarding the rarity of a Pokémon.
Dataset Preprocessing
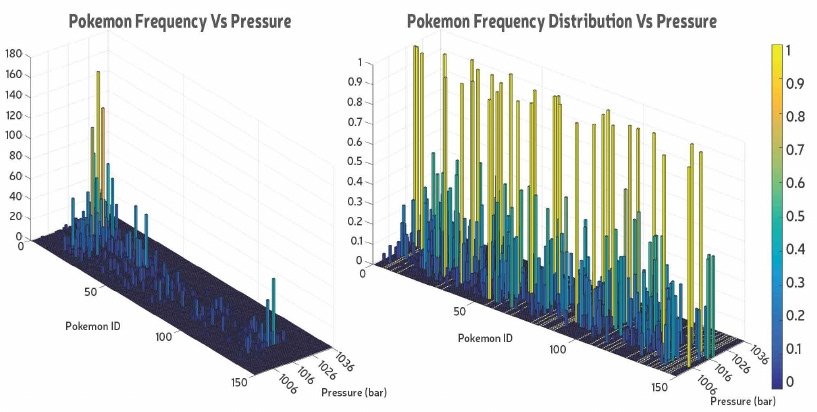
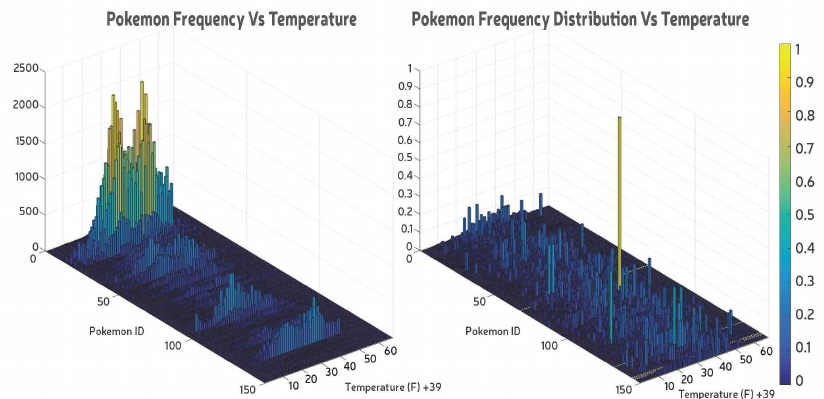
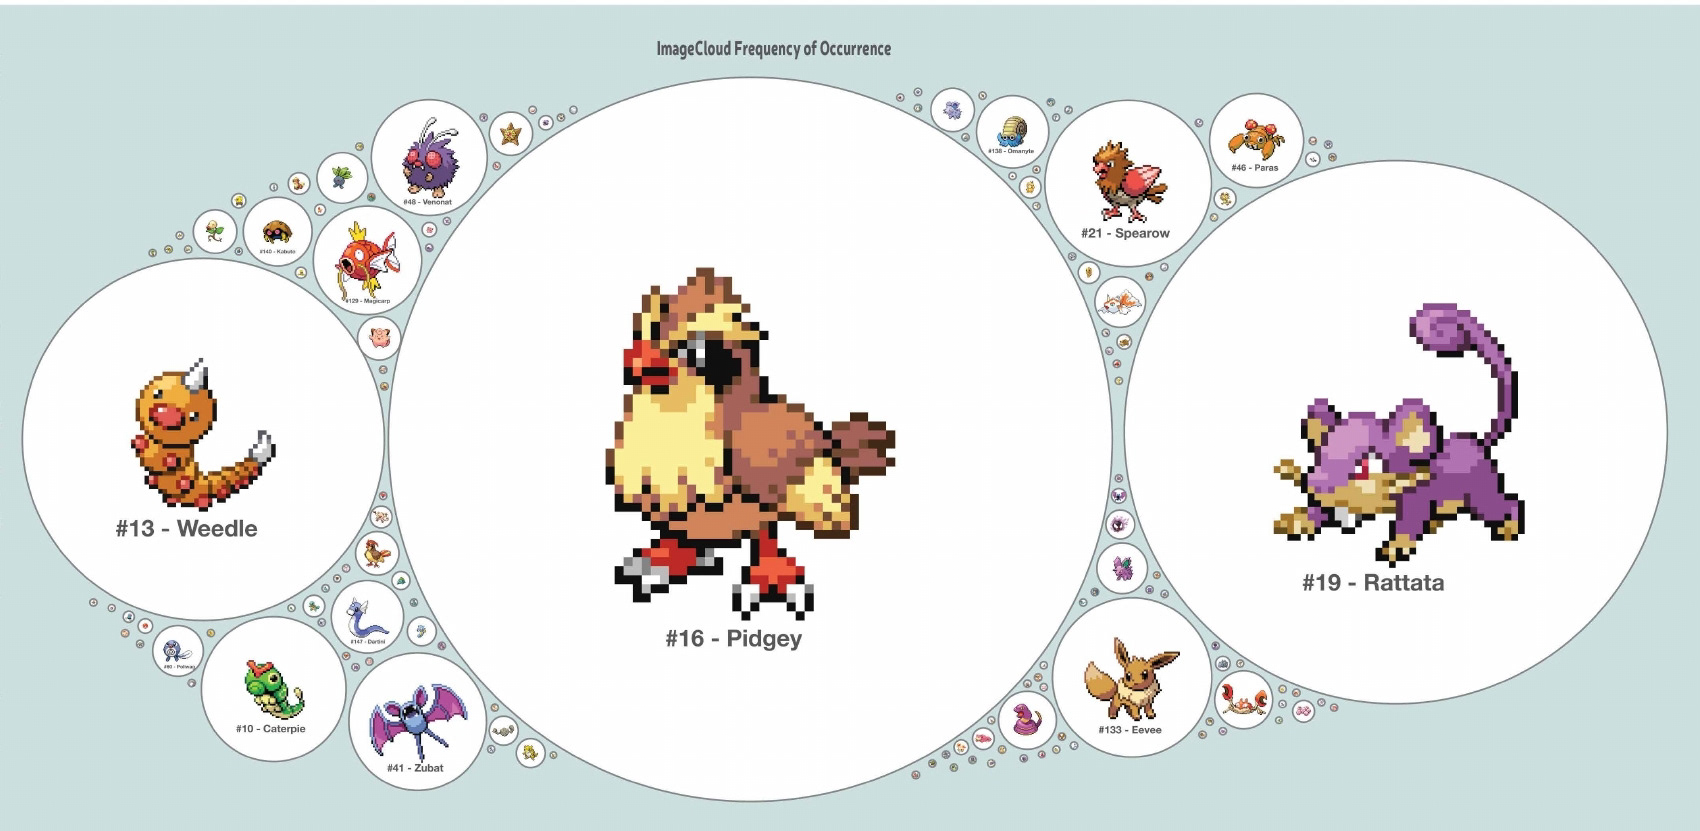
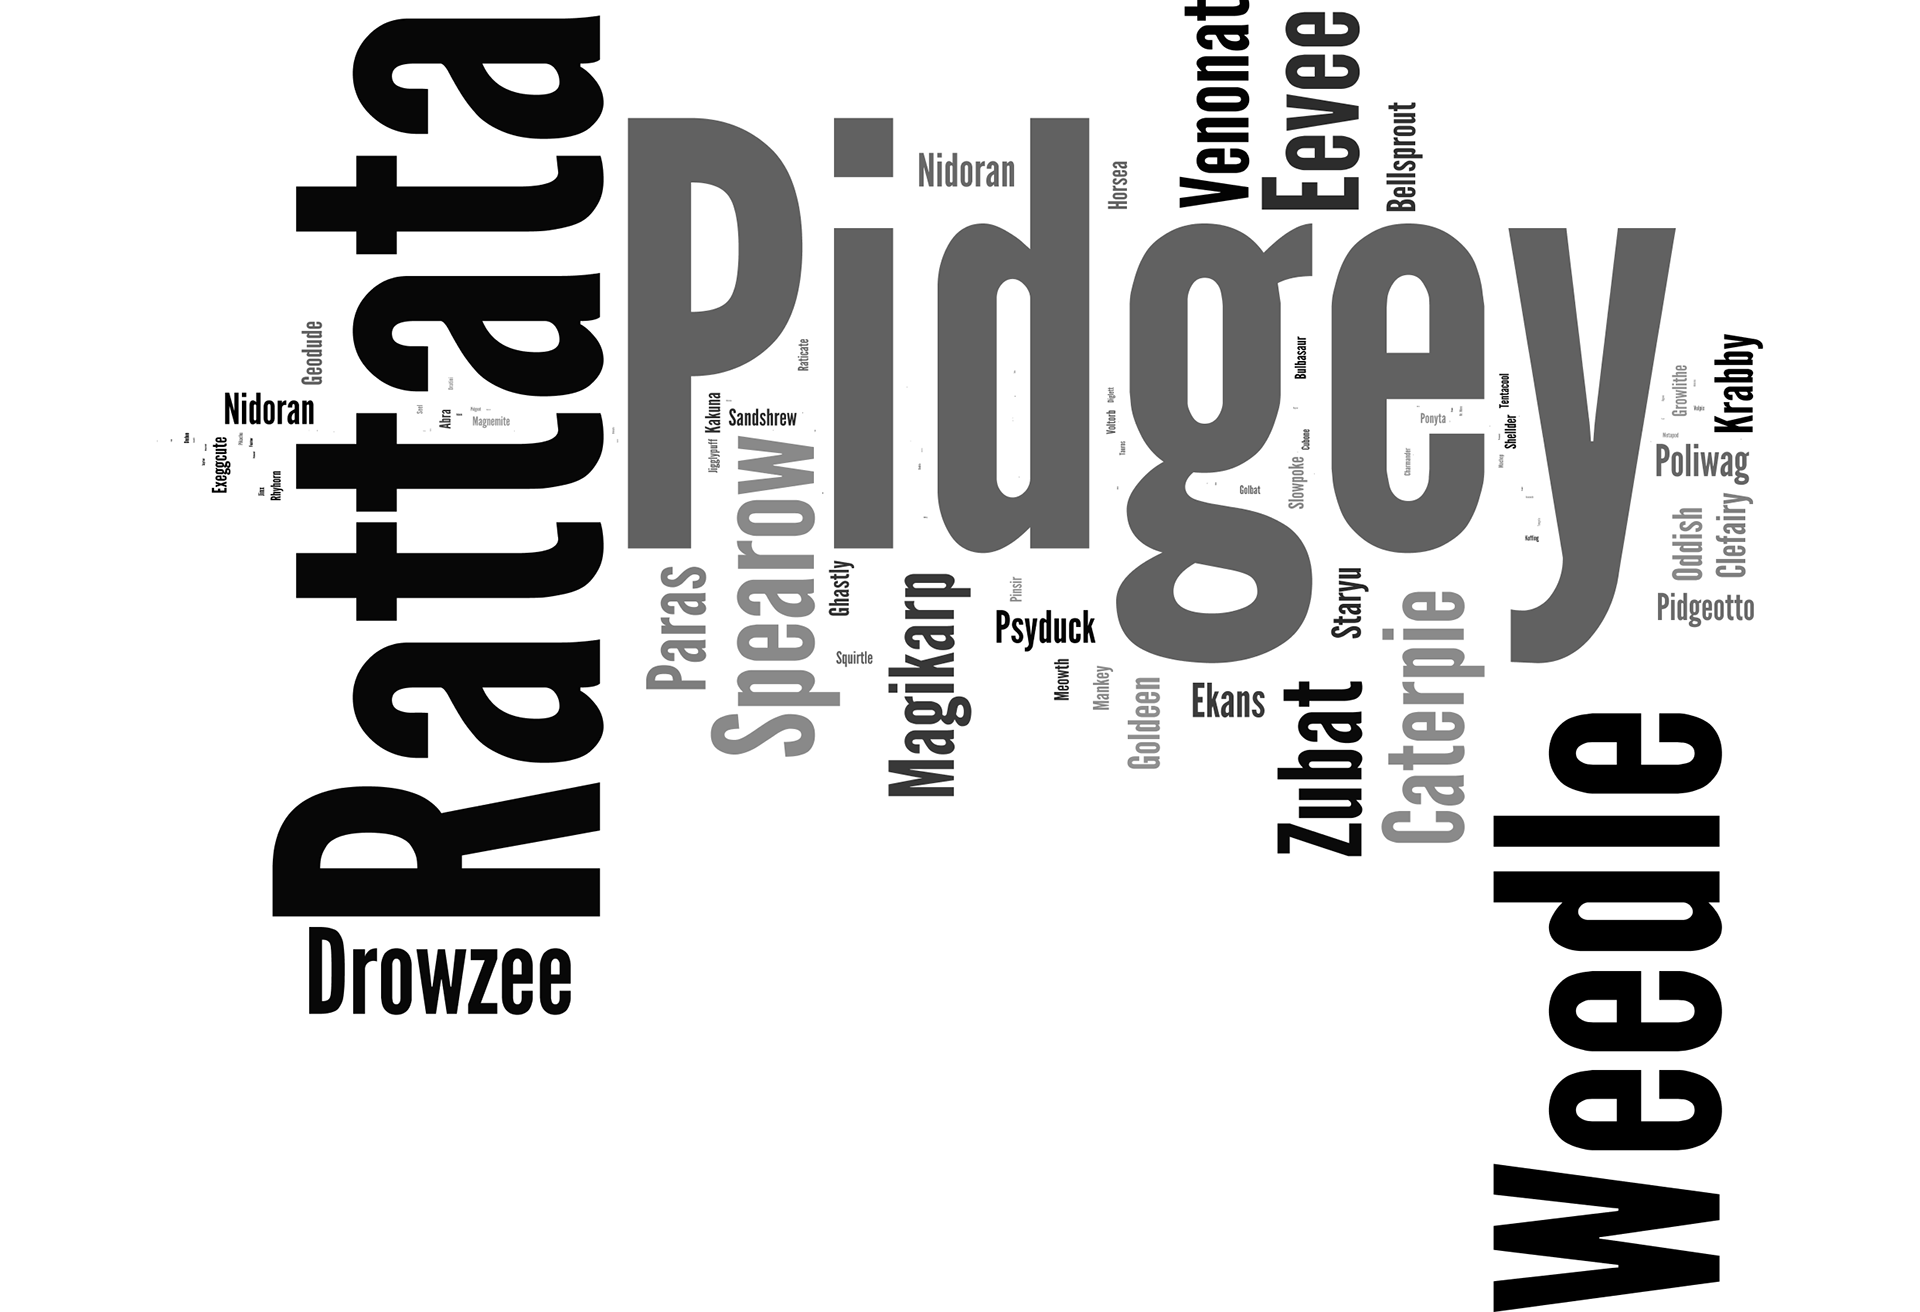
I sorted ~300,000 occurrences of Pokémon according to Pokémon ID (1-151) and frequency at a particular feature value (for eg. at 1016 bar for pressure).
At this stage we found that Pidgey (id no. 16) occurred the most and this went on to have a huge impact on our results for each question.
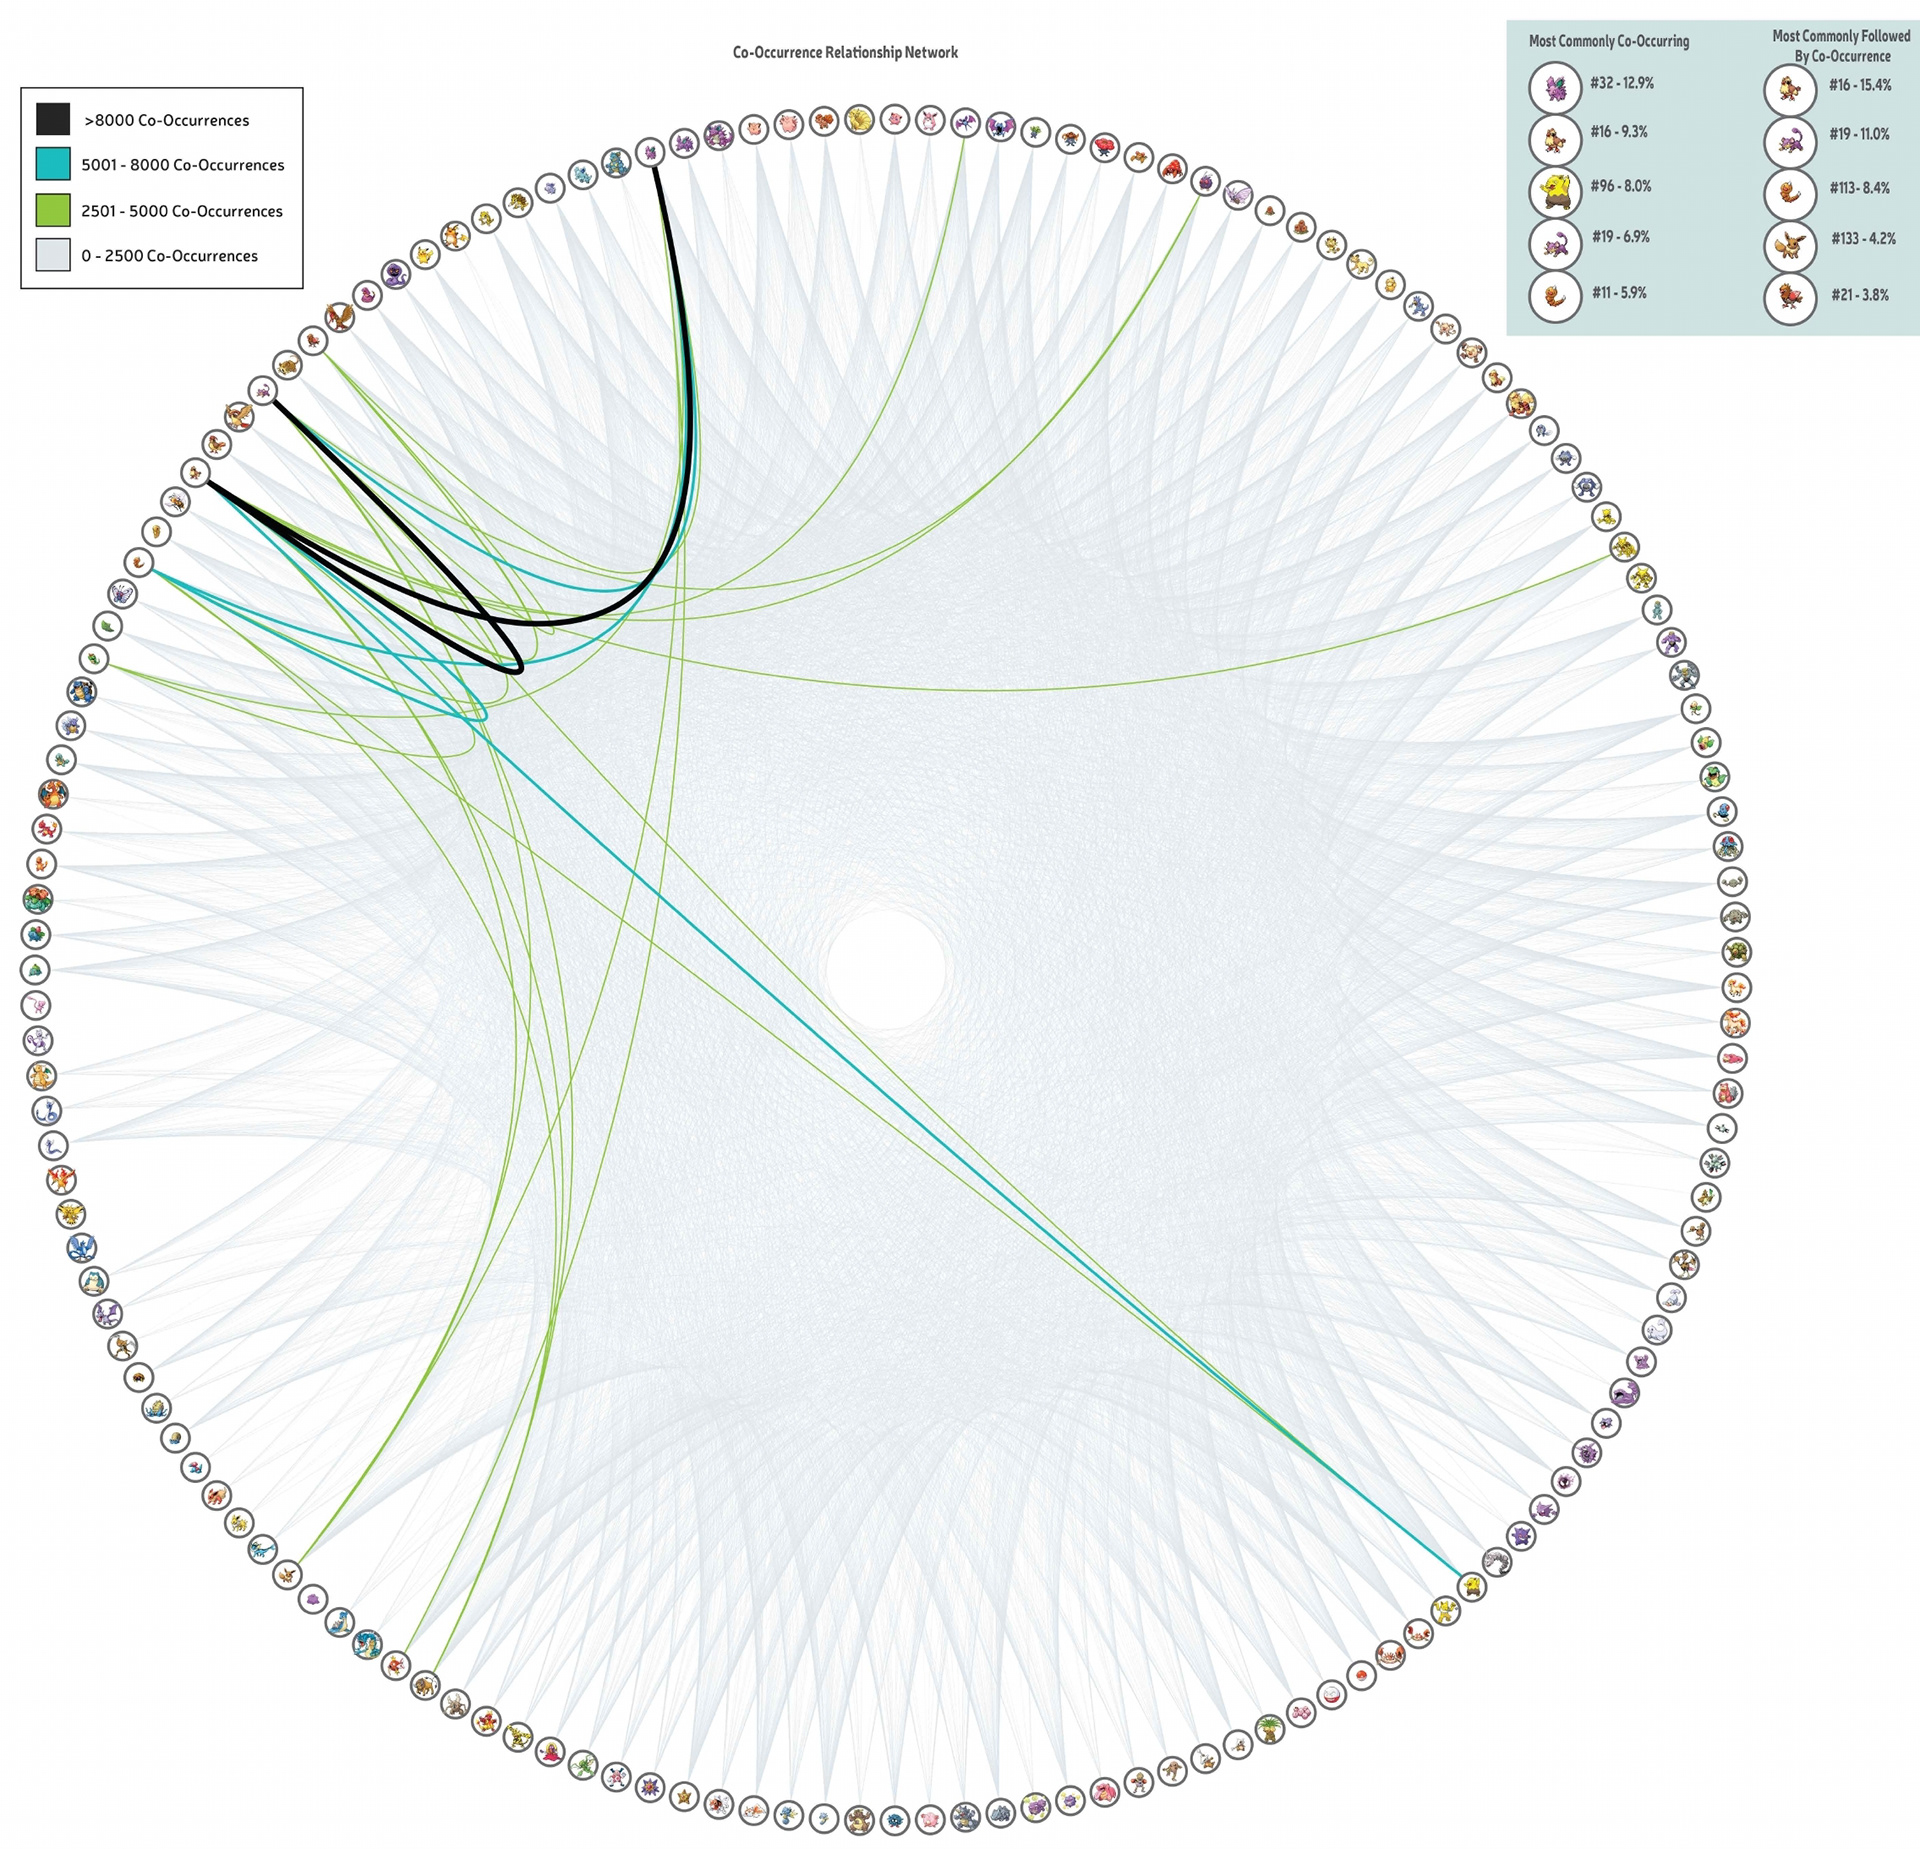
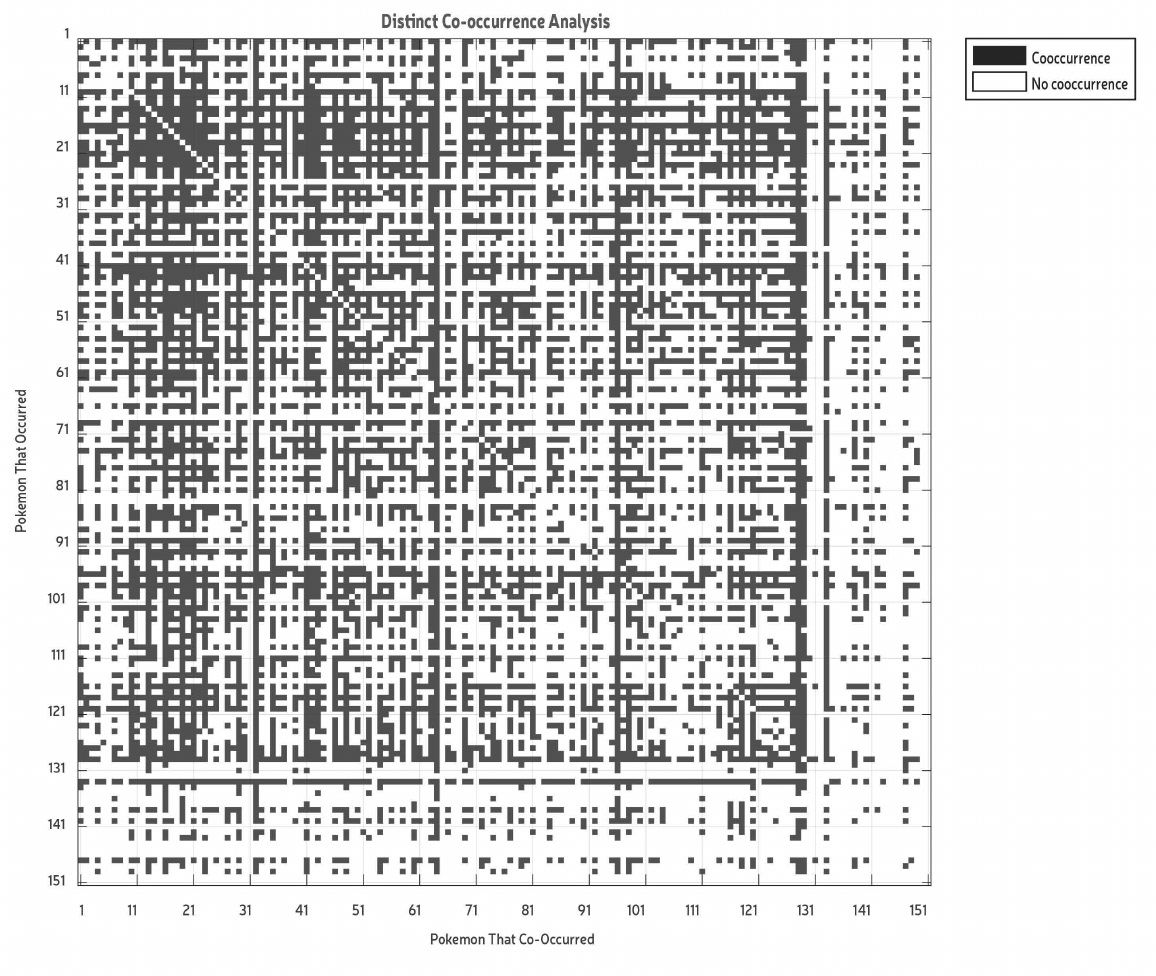
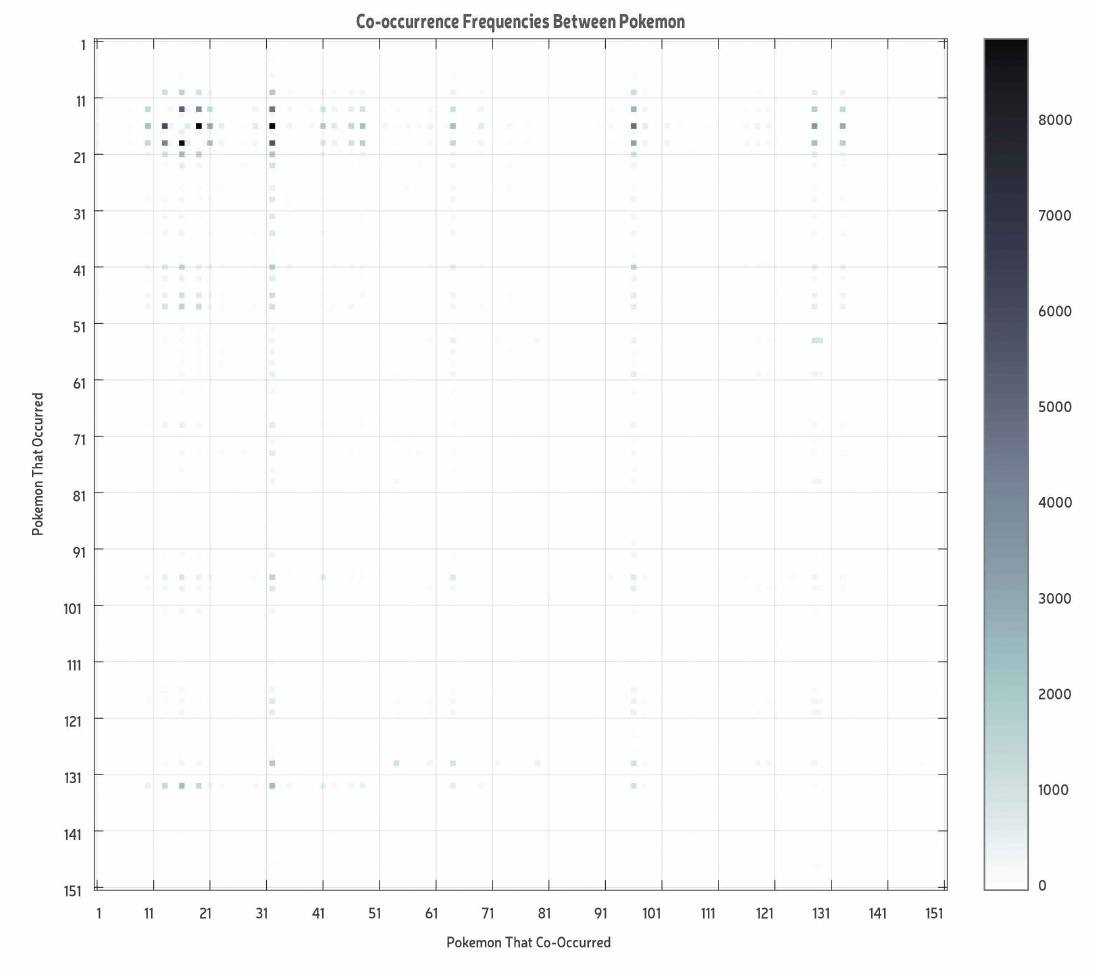
Which Pokemon co occur the most?
We created a 151 by 151 matrix of Boolean data from the main dataset to visualize co-occurrence. We did this by sorting and summing up co-occurrences and creating heat maps and a co-occurrence relationship network.
One heat map showed whether a co-occurrence between 2 Pokémon occurred or not (yes/no data) and the other one took frequency of co-occurrences into account (depicted using color). We found that #32 was the most common co-occurring and #16 was most commonly followed by a co-occurrence. This means that if a player wants to find more Pokémon they should find #32 or #16.
Overall, the frequency of a Pokémon in the dataset had an effect on each of the questions we had asked. The importance of the questions is inherent in the conditions a player should look for in order to catch the most Pokémon.
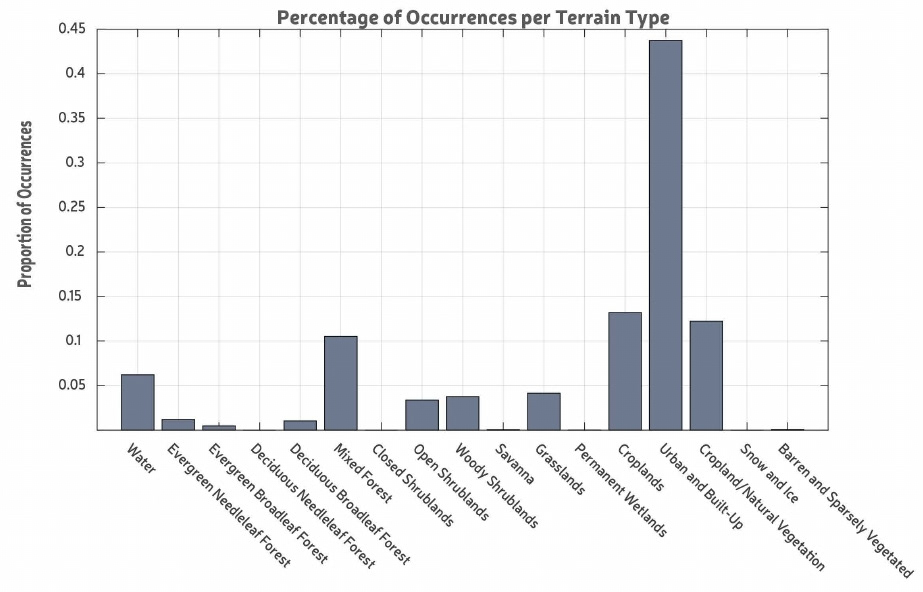
Does the distribution of Pokemon differ based on setting and terrain?
We decided to use visualization (bar graphs and heat map) since we were interested in understanding the distribution of Pokémon according to setting and terrain. For terrain, our bar graph showing the distribution of Pokémon across various terrain types and our heat map showed more detailed information with Pokémon id against terrain type wherein color corresponded to frequency information.
We found that most of the Pokémon were found in ‘Urban and built up’ terrain followed by cropland and natural vegetation; the least were found in wetlands and snowy and barren areas. However, while interpreting we didn’t know whether this was because people just played more/less in those areas or because Pokémon were distributed more/less according to those terrain types.
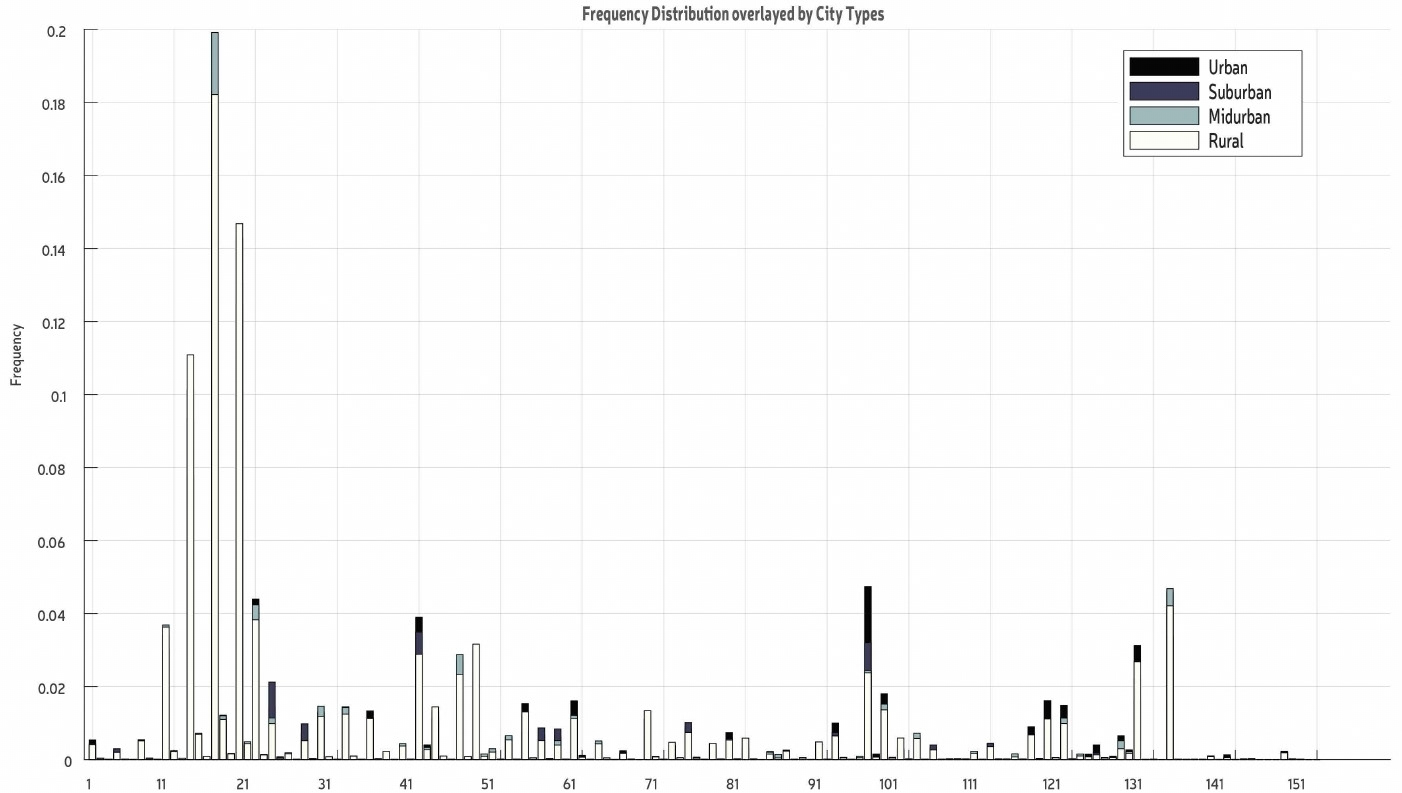
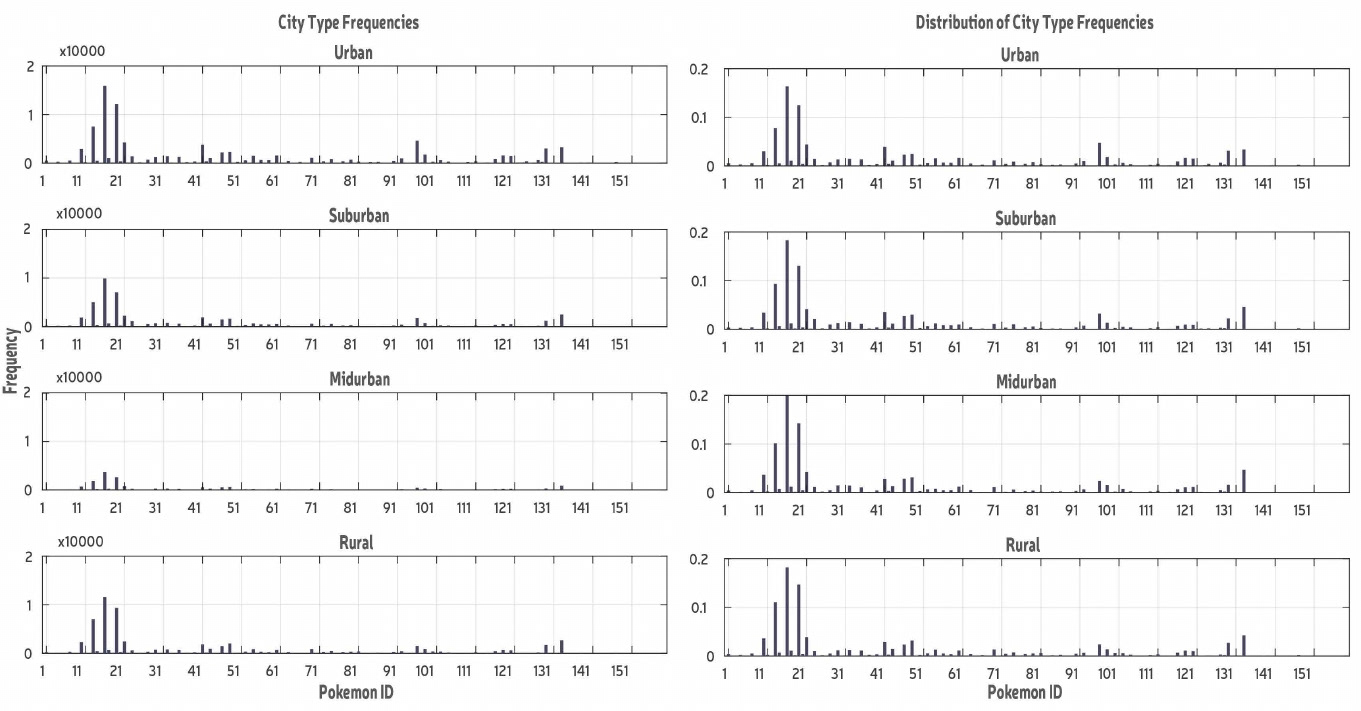
The other aspect of this question was setting. We had 4 major settings (urban, suburban, midurban and rural) which were classified in our dataset based on population density.
We calculated the percent composition of the dataset by dividing the frequency of a Pokémon by the total frequency and plotted that to see the percent contribution of each Pokémon relative to another. We found that the distribution pattern was nearly identical with peaks at #13, #16 and #19 which corresponded to the most frequently occurring Pokémon in the main dataset.
Overlaying the graphs on one another exposed some small differences arising in the frequencies in certain settings. Thus, we concluded that the distribution of a Pokémon in a setting depends upon its frequency in the main dataset.

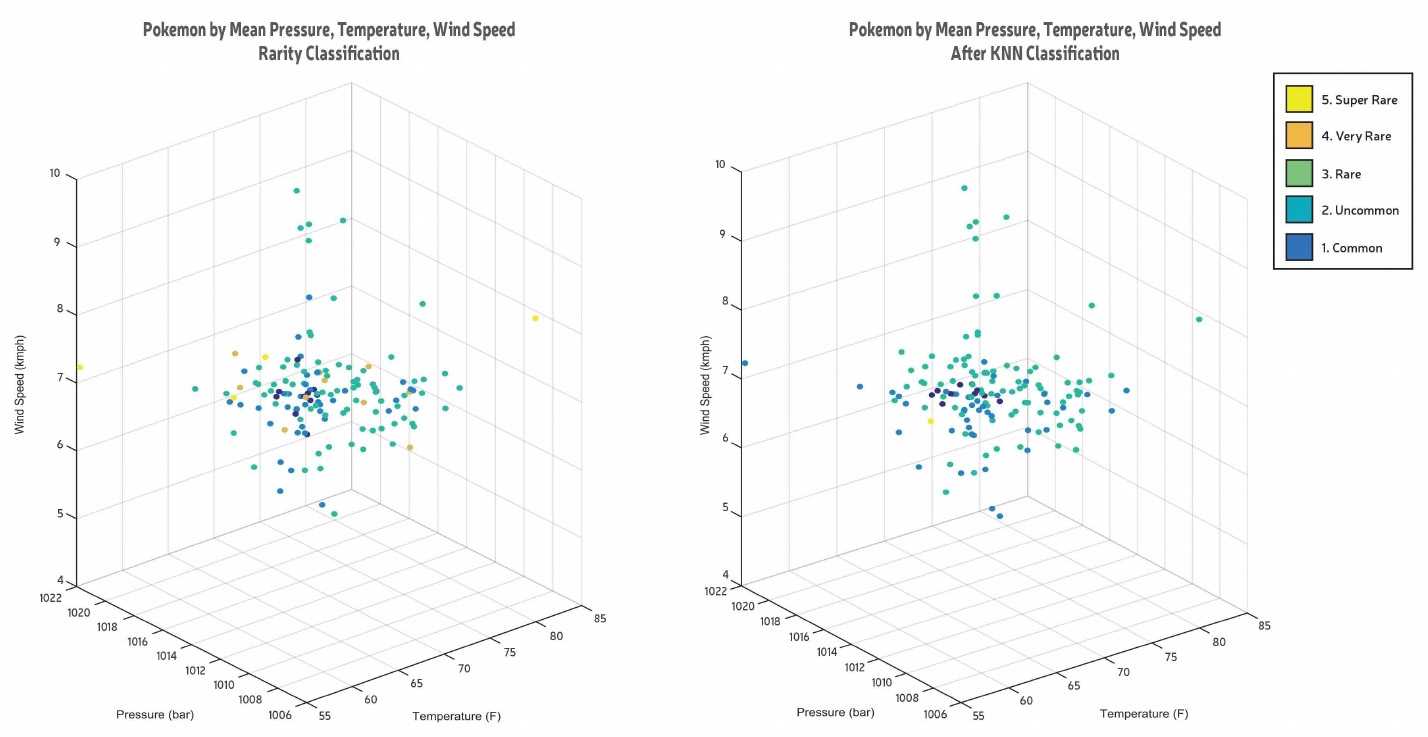
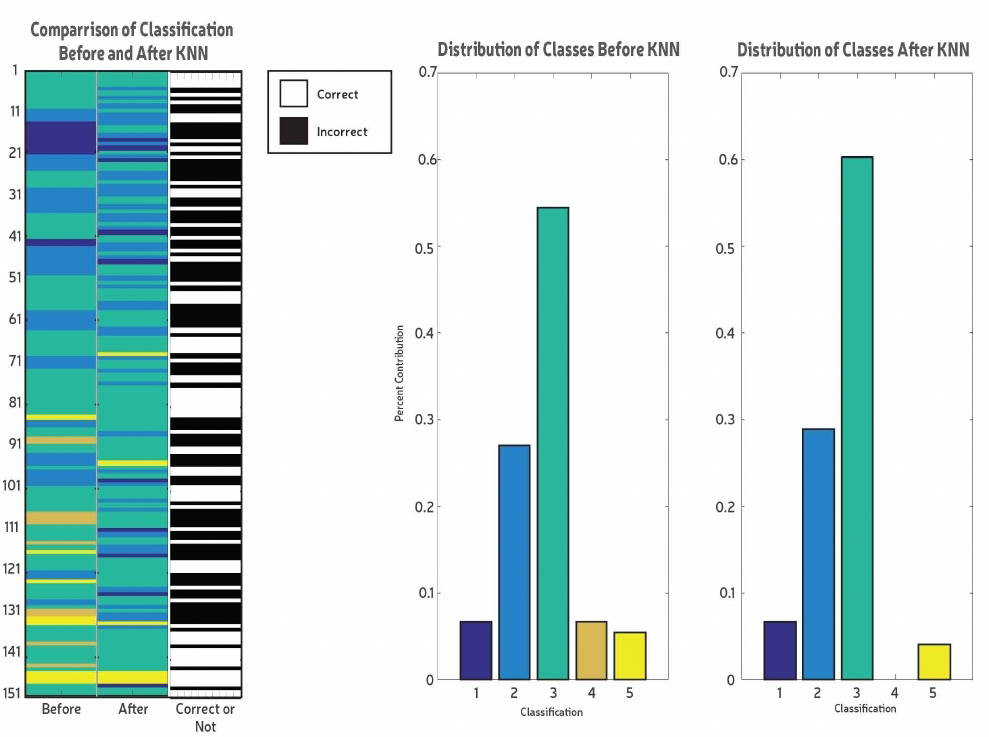
Can we classify the rarity of a Pokemon based on environmental conditions (wind speed, temperature and pressure)?
We visualized the preprocessing data using 3D bar graphs to understand the spread and were not surprised to find that the highest peaks usually occurred at around 16. Following this, as the question involved classifying the rarity of the Pokémon based on environmental conditions, we decided to use K-Nearest Neighbors classification because it would allow us to classify Pokémon based on other Pokémon closest to it and thus take similar environmental conditions into account. On plotting the data before KNN according to mean temperature, pressure and wind speed with the color corresponding to the rarity classification found in the supplementary dataset, we found that the Pokémon rarity was pretty scattered and thus we were not sure whether KNN would actually work to classify correctly. After running KNN we saw that the classifications had changed quite drastically; KNN had only classified 46% of the Pokémon correctly and had changed the distribution of the rarity classes, completely eradicating one. We concluded that classifying the rarity of the Pokémon based on environmental conditions using KNN was not very successful and perhaps using other features that allowing for separate clusters of similar classifications would be better.